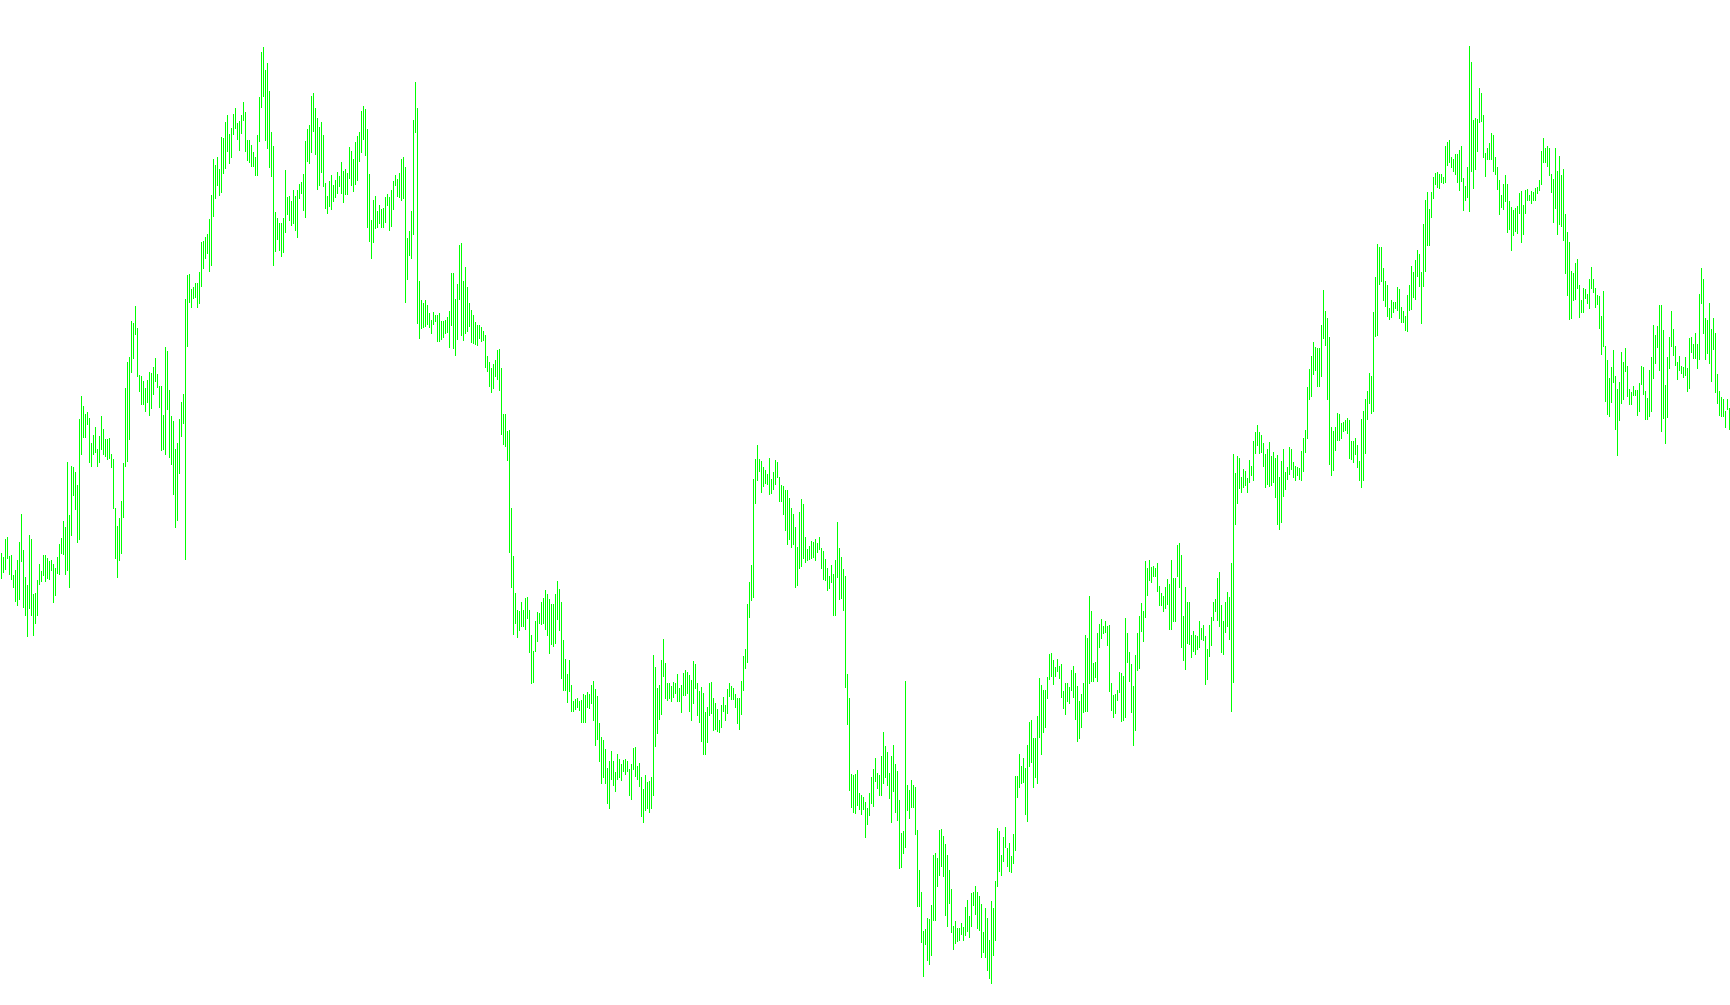
This tool is designed to analyze price movements by identifying trends and momentum in the financial markets. It works by processing historical price data into several distinct visual layers, helping traders see the "rhythm" of the market rather than just the raw price fluctuations.
Core Logic Overview
The script functions by calculating three primary components: the MACD (Moving Average Convergence Divergence), a Signal Line, and a Momentum oscillator. Here is how these pieces work together:
1. The Foundation: Moving Averages The tool starts by looking at two different types of averages: a "Fast" average and a "Slow" average.
- The Fast Average reacts quickly to recent price changes.
- The Slow Average tracks the broader, long-term trend. By subtracting the slow average from the fast average, the script identifies the gap between short-term movement and long-term direction. This is represented as a histogram.
2. The Signal Line To make the data easier to read, the script takes the results of that first calculation (the MACD) and applies another smoothing process to it. This creates a "Signal Line." Traders often look for moments where the histogram crosses this line, as these intersections can indicate potential shifts in trend direction.
3. Momentum Analysis Beyond standard trend following, this script includes a specific logic for measuring "Momentum." It calculates the difference between the current MACD value and its value from a specific point in the past (10 periods ago). This tells you how much "speed" or "force" is behind the current move.
4. Smoothing for Clarity Because raw market data can be very "noisy" and jumpy, the script applies an additional smoothing layer to the momentum data. This filters out minor fluctuations, allowing the user to see the underlying strength of a move more clearly without being distracted by temporary spikes.
Summary of User Experience
When you view this on a chart, the logic provides a multi-layered view:
- The Histogram/Lines: Show you the current direction and the gap between short and long-term trends.
- The Momentum Layers: Show you how fast that trend is accelerating or decelerating.
Essentially, while a standard indicator might tell you where the price is going, this script's logic attempts to show you how much energy is behind that movement, providing a more comprehensive picture of market dynamics.
//+------------------------------------------------------------------+
//|                                                MACD_Momentum.mq4 |
//|                                                 GGG Mâcon France |
//+------------------------------------------------------------------+
#property copyright   "2005-2014, MetaQuotes Software Corp."
#property link        "http://www.mql4.com"
#property description "Moving Averages Convergence/Divergence"
#property strict

//#include <MovingAverages.mqh>

//--- indicator settings
#property  indicator_separate_window
#property  indicator_buffers 4
#property  indicator_color1  Gray// Silver
#property  indicator_color2  Yellow
#property  indicator_color3  White// Silver
#property  indicator_color4 Red // Magenta


#property  indicator_width1  2
//--- indicator parameters
input int InpFastEMA=12;
input int InpSlowEMA=26;
input int InpSignalSMA=9;
input int smooth = 3;
//--- indicator buffers
double    ExtMacdBuffer[];
double    ExtSignalBuffer[];
double    Mom[];
double    Mom_smooth[];
//--- right input parameters flag
bool      ExtParameters=false;

//+------------------------------------------------------------------+
//| Custom indicator initialization function                         |
//+------------------------------------------------------------------+
int OnInit(void)
  {
   IndicatorDigits(Digits+1);
//--- drawing settings
   SetIndexStyle(0,DRAW_HISTOGRAM);
   SetIndexStyle(1,DRAW_LINE);
   SetIndexDrawBegin(1,InpSignalSMA);
//--- indicator buffers mapping
   SetIndexBuffer(0,ExtMacdBuffer);
   SetIndexBuffer(1,ExtSignalBuffer);
//--- name for DataWindow and indicator subwindow label
   IndicatorShortName("MACD("+IntegerToString(InpFastEMA)+","+IntegerToString(InpSlowEMA)+","+IntegerToString(InpSignalSMA)+")");
   SetIndexLabel(0,"MACD");
   SetIndexLabel(1,"Signal");
//--- check for input parameters

    SetIndexBuffer(2,Mom );
    SetIndexStyle(2,DRAW_LINE,0,1);

     SetIndexBuffer(3,Mom_smooth );
    SetIndexStyle(3,DRAW_LINE,0,3);

   if(InpFastEMA<=1 || InpSlowEMA<=1 || InpSignalSMA<=1 || InpFastEMA>=InpSlowEMA)
     {
      Print("Wrong input parameters");
      ExtParameters=false;
      return(INIT_FAILED);
     }
   else
      ExtParameters=true;
//--- initialization done
   return(INIT_SUCCEEDED);
  }
//+------------------------------------------------------------------+
//| Moving Averages Convergence/Divergence                           |
//+------------------------------------------------------------------+
int OnCalculate (const int rates_total,
                 const int prev_calculated,
                 const datetime& time[],
                 const double& open[],
                 const double& high[],
                 const double& low[],
                 const double& close[],
                 const long& tick_volume[],
                 const long& volume[],
                 const int& spread[])
  {
   int i,limit;
//---
   if(rates_total<=InpSignalSMA || !ExtParameters)    return(0);
//--- last counted bar will be recounted
   limit=rates_total-prev_calculated;
   if(prev_calculated==0)     limit = rates_total- 3000;
   if(prev_calculated>0)     limit--;
//--- macd counted in the 1-st buffer
   for(i=limit; i>=0; i--)     ExtMacdBuffer[i]=iMA(NULL,0,InpFastEMA,0,MODE_EMA,PRICE_CLOSE,i)-
                               iMA(NULL,0,InpSlowEMA,0,MODE_EMA,PRICE_CLOSE,i);
//--- signal line counted in the 2-nd buffer
  // SimpleMAOnBuffer(rates_total,prev_calculated,0,InpSignalSMA,ExtMacdBuffer,ExtSignalBuffer);
    for(i=limit; i>=0; i--) ExtSignalBuffer[i] =  iMAOnArray(ExtMacdBuffer,0,InpSignalSMA,0,0,i);


  for(i=limit; i>=0; i--) Mom[i] = ExtMacdBuffer[i] - ExtMacdBuffer[i+10];
  for(i=limit; i>=0; i--) Mom_smooth[i] = iMAOnArray(Mom,0,smooth,0,0,i);


//--- done
   return(rates_total);
  }
//+------------------------------------------------------------------+
Comments