LOCKijunSenChannel
Download script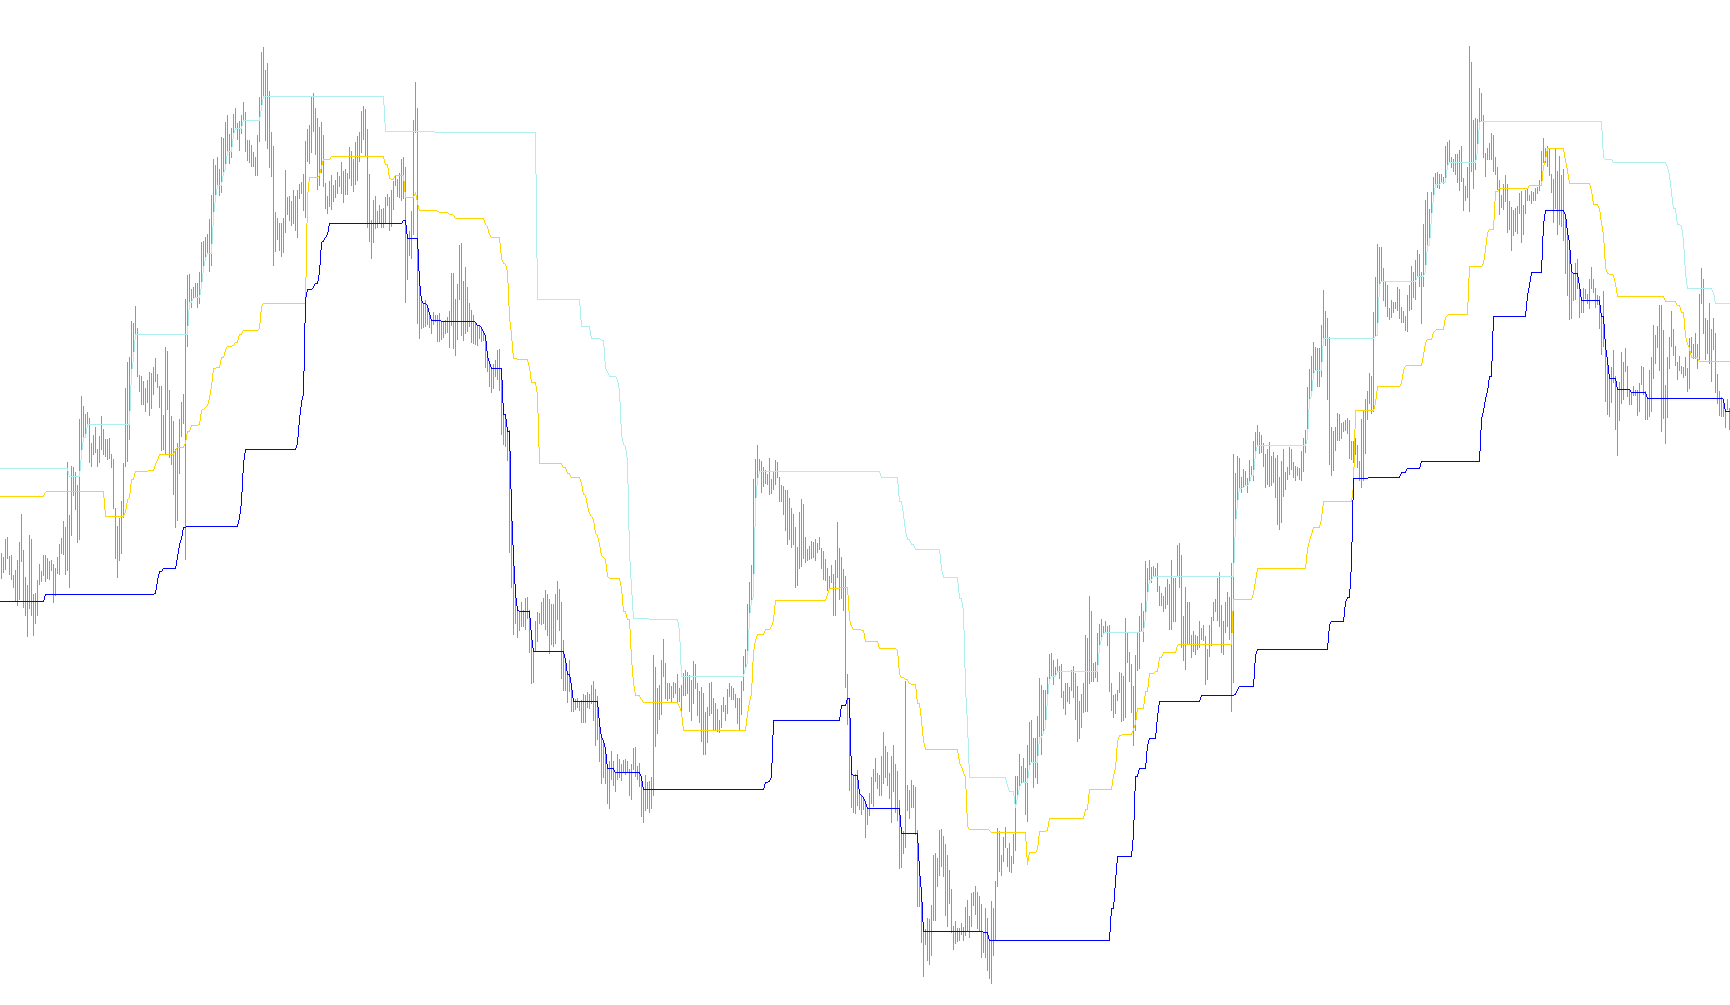
This technical indicator is designed to provide traders with a visual representation of market sentiment and price extremes by utilizing the "Kijun-Sen" logic. It identifies key price levels by analyzing historical data over a specific moving window, helping users determine the balance between highs and lows in the current market environment.
Core Functionality
The indicator calculates three distinct lines on your chart to help identify support, resistance, and the equilibrium price:
- The Equilibrium Line (Kijun-Sen): This is the primary calculation of the script. It identifies the highest peak and the lowest valley over a user-defined period (defaulting to 61 bars). The indicator then calculates the mathematical midpoint between these two extremes. This serves as a "mean" price, showing where the market has balanced itself over that timeframe.
- The Boundary Lines: In addition to the central equilibrium, the script identifies two additional boundary levels. These represent the specific high and low extremes found within the same period. By plotting both the top and bottom boundaries alongside the center line, the tool provides a visual "channel" of price action.
How it Works
- Dynamic Analysis: The script automatically scans the historical data based on the timeframe you are currently viewing.
- Price Detection: It searches backward through a set number of candles to find the absolute highest price point and the absolute lowest price point reached during that window.
- Visual Mapping: Once these points are identified, it draws three continuous lines: one for the "Top" boundary, one for the "Bottom" boundary, and one for the "Center" equilibrium.
Practical Application
For a trader, this tool acts as a visual guide for market volatility. When price is trading far away from the central Kijun-Sen line, it may indicate an overextended market. Conversely, when the price interacts with the top or bottom boundary lines, it highlights areas of significant historical resistance or support. By providing all three lines simultaneously, the script allows you to see not just where the "middle" is, but the entire range of price movement for a specific period.
//+---------------------------------------------------------------------+
//|                                                  LOC-KijunSen.mq4   |
//| For more EXPERTS, INDICATORS, TRAILING EAs and SUPPORT Please visit:|
//|                                      http://www.landofcash.net      |
//|           Our forum is at:   http://forex-forum.landofcash.net      |
//+---------------------------------------------------------------------+
#property copyright "Mikhail"
#property link      "http://www.landofcash.net"

#property indicator_chart_window
#property indicator_buffers 3
//Line
#property indicator_color1 OrangeRed
#property indicator_width1 2
#property indicator_style1 STYLE_SOLID

#property indicator_color2 OrangeRed
#property indicator_width2 1
#property indicator_style2 STYLE_SOLID

#property indicator_color3 OrangeRed
#property indicator_width3 1
#property indicator_style3 STYLE_SOLID


string _name = "LOC-RKijunSen";
string _ver="v1.2";
//---------------------------------------------
//indicator parameters
extern int _period=61;
extern int _timeframe=0;
//---------------------------------------------
double _line[];
double _topLine[];
double _bottomLine[];
double _pipsMultiplyer=1;

int init()
{
   Print(_name+" - " + _ver);
   IndicatorShortName(_name+" - " + _ver);
   Comment(_name+" " + _ver+" @ "+"http://www.landofcash.net");
//init buffers
   IndicatorBuffers(3);
   SetIndexBuffer(0,_line);
   SetIndexBuffer(1,_topLine);
   SetIndexBuffer(2,_bottomLine);

//set draw style
   SetIndexStyle(0,DRAW_LINE);
   SetIndexLabel(0,"KijunSen");
    SetIndexStyle(1,DRAW_LINE);
   SetIndexLabel(1,"Bottom KijunSen");
   SetIndexStyle(2,DRAW_LINE);
   SetIndexLabel(2,"Bottom KijunSen");


   //get pip value
   if(Digits == 2 || Digits == 4) {
      _pipsMultiplyer = 1;
   } else {
      if(Digits == 3 || Digits == 5) {
         _pipsMultiplyer = 10;
      }
   }
   return(0);
}

int deinit()
{
   return(0);
}

int start()
  {
   int    counted_bars=IndicatorCounted();
   if(Bars<=_period) {return(0);}
   int i=Bars-counted_bars-1;
   while(i>=0)
   {
      int barShift=iBarShift(Symbol(),_timeframe,iTime(Symbol(),Period(),i),false);
      double max=iHigh(Symbol(),_timeframe,iHighest(Symbol(),_timeframe,MODE_HIGH,_period,barShift));
      double min=iLow(Symbol(),_timeframe,iLowest(Symbol(),_timeframe,MODE_LOW,_period,barShift));
      double minMax=iHigh(Symbol(),_timeframe,iLowest(Symbol(),_timeframe,MODE_HIGH,_period,barShift));
      double maxMin=iLow(Symbol(),_timeframe,iHighest(Symbol(),_timeframe,MODE_LOW,_period,barShift));
       _line[i]=(max+min)/2;
       _topLine[i]=minMax;
       _bottomLine[i]=maxMin;
      i--;
   }
   return(0);
  }
Comments