MACD MA Price
Download script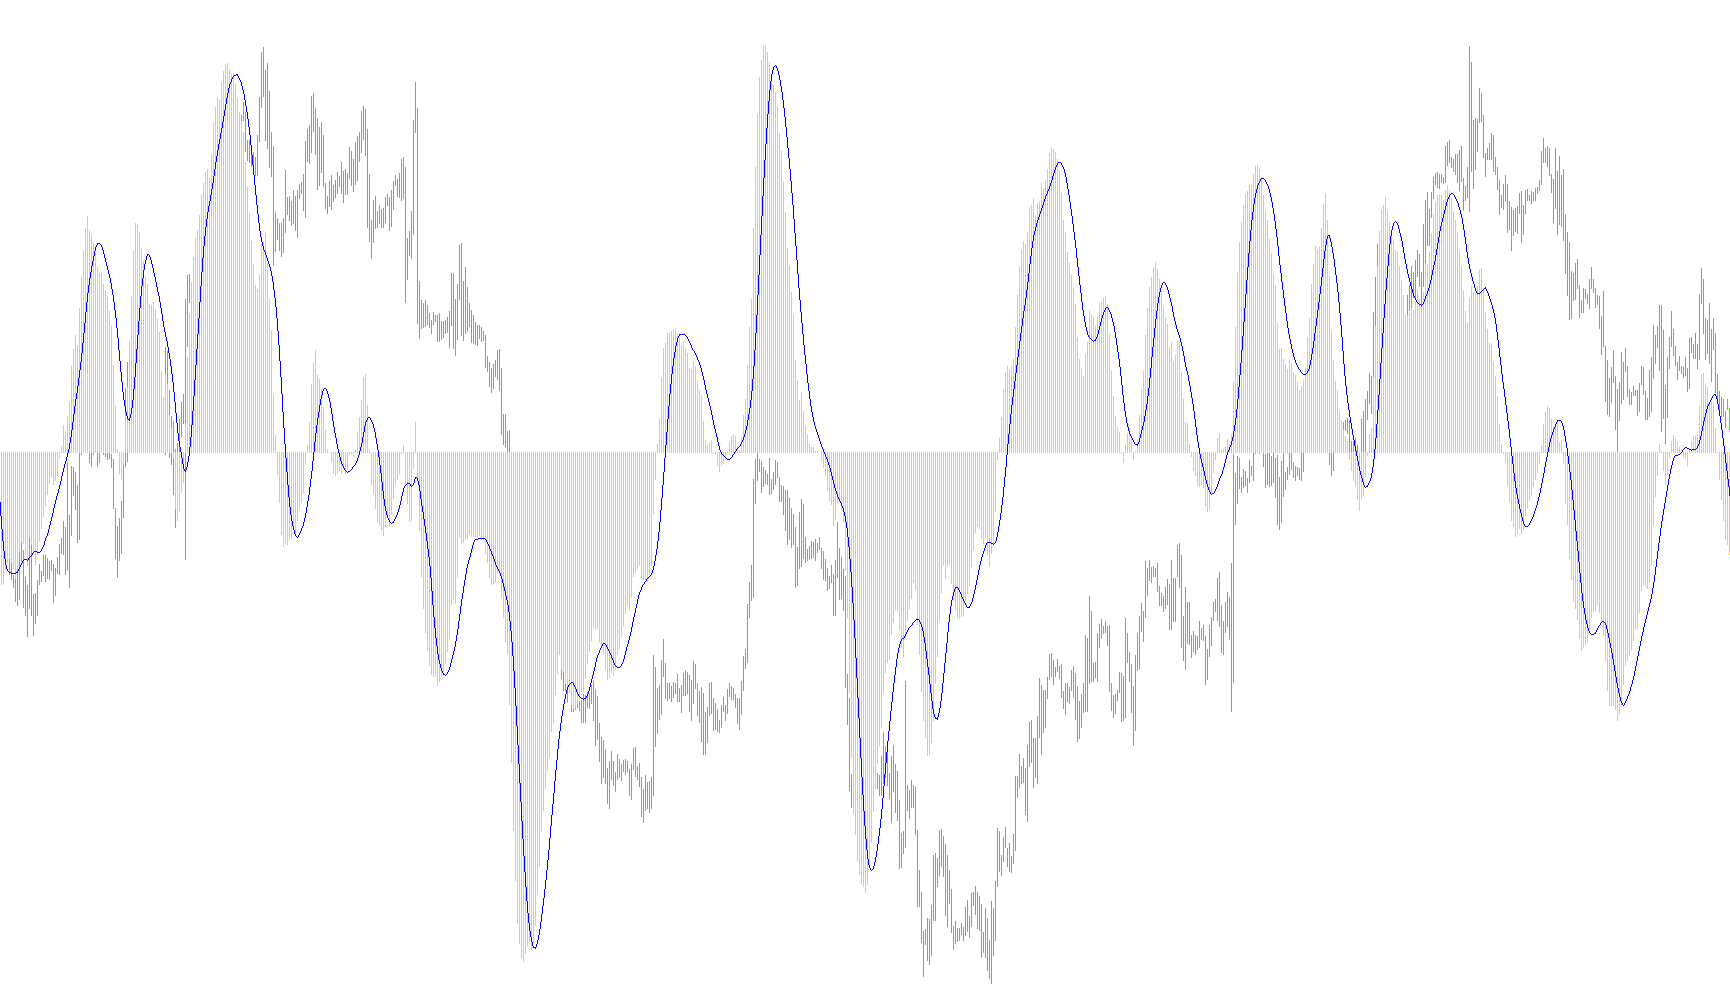
The MACD MA Price indicator is a technical analysis tool designed to help traders visualize market momentum and identify potential trends by analyzing the relationship between two different moving averages. By processing price data into a visual format, it helps simplify the complexity of market fluctuations into actionable insights.
Core Logic and Functionality
The script operates through a three-step calculation process:
1. Defining the Primary MACD Base The tool begins by calculating two separate Moving Averages (MAs) based on user-defined timeframes (Fast and Slow periods).
- The Fast Period tracks shorter-term price movements.
- The Slow Period tracks longer-term price trends.
The indicator then calculates the difference between these two averages. This difference represents the "MACD" value, which tells you how much the short-term price is leading or lagging behind the long-term average. If the gap is widening, it suggests increasing momentum; if it is narrowing, it suggests the trend may be losing steam.
2. Calculating the Signal Line Once the primary MACD values are established, the script performs a second layer of smoothing. It applies a "Signal" moving average directly onto the resulting MACD data. This creates a secondary line that smooths out minor fluctuations (noise) in the primary MACD. Traders often look for the "crossings" between this Signal Line and the primary MACD to identify potential entry or exit points for trades.
3. Customization Options The script provides several professional-grade variables that allow users to tailor the logic to different markets:
- MA Methods: Users can choose between four different types of moving average calculations (Simple, Exponential, Smoothed, or Linear Weighted), depending on how reactive they want the indicator to be.
- Applied Price: The tool allows you to choose which specific price point to analyze—such as the standard closing price, the opening price, the high/low of a candle, or even median prices. This ensures the indicator can be adapted to specific trading styles.
Visual Representation
The final output is displayed in a dedicated sub-window below your main chart:
- Histogram: Represents the raw MACD difference between the fast and slow periods.
- Signal Line: A smooth line that follows the histogram, used to confirm trend shifts and momentum changes.
//+------------------------------------------------------------------+
//|                                                MACD MA Price.mq4 |
//|                                                        Paladin80 |
//|                                                  forevex@mail.ru |
//+------------------------------------------------------------------+
#property copyright "Paladin80"
#property link      "forevex@mail.ru"
//---- indicator settings
#property  indicator_separate_window
#property  indicator_buffers 2
#property  indicator_color1  Silver
#property  indicator_color2  Red
#property  indicator_width1  2
//---- indicator parameters
extern int Fast_period=12;
extern int Slow_period=26;
extern int Signal_period=9;
//----
extern int MACD_MA_method=1;
extern int Signal_MA_method=0;
extern int Applied_price=0;
bool       error=false;
/* MACD_MA_method and Signal_MA_method:
              0 - Simple moving average,
              1 - Exponential moving average,
              2 - Smoothed moving average,
              3 - Linear weighted moving average.
Applied_price: 0 - Close price,
               1 - Open price,
               2 - High price,
               3 - Low price,
               4 - Median price,
               5 - Typical price,
               6 - Weighted close price, */
//---- indicator buffers
double     MacdBuffer[];
double     SignalBuffer[];

//+------------------------------------------------------------------+
//| Custom indicator initialization function                         |
//+------------------------------------------------------------------+
int init()
  {
//---- drawing settings
   SetIndexStyle(0,DRAW_HISTOGRAM);
   SetIndexStyle(1,DRAW_LINE);
   SetIndexDrawBegin(1,Signal_period);
   IndicatorDigits(Digits+1);
//---- indicator buffers mapping
   SetIndexBuffer(0,MacdBuffer);
   SetIndexBuffer(1,SignalBuffer);
//---- name for DataWindow and indicator subwindow label
   IndicatorShortName("MACD("+Fast_period+","+Slow_period+","+Signal_period+")");
   SetIndexLabel(0,"MACD");
   SetIndexLabel(1,"Signal");
//---- initialization done
   if (MACD_MA_method<0 || MACD_MA_method>3)
   {  error=true;
      Alert("Please select correct MACD_MA_method (0-3) for indicator MACD MA Price");
   }
   if (Signal_MA_method<0 || Signal_MA_method>3)
   {  error=true;
      Alert("Please select correct Signal_MA_method (0-3) for indicator MACD MA Price");
   }
   if (Applied_price<0 || Applied_price>6)
   {  error=true;
      Alert("Please select correct Applied_price (0-6) for indicator MACD MA Price");
   }
//----
   return(0);
  }
//+------------------------------------------------------------------+
//| Moving Averages Convergence/Divergence                           |
//+------------------------------------------------------------------+
int start()
  {
//----
   if (error==true) return(0);
//----
   int limit;
   int counted_bars=IndicatorCounted();
//---- last counted bar will be recounted
   if(counted_bars>0) counted_bars--;
   limit=Bars-counted_bars;
//---- macd counted in the 1-st buffer
   for(int i=0; i<limit; i++)
      MacdBuffer[i]=iMA(NULL,0,Fast_period,0,MACD_MA_method,Applied_price,i)-iMA(NULL,0,Slow_period,0,MACD_MA_method,Applied_price,i);
//---- signal line counted in the 2-nd buffer
   for(i=0; i<limit; i++)
      SignalBuffer[i]=iMAOnArray(MacdBuffer,Bars,Signal_period,0,Signal_MA_method,i);
//---- done
   return(0);
  }
//+------------------------------------------------------------------+
Comments