Limiteddonchianchanel
Download script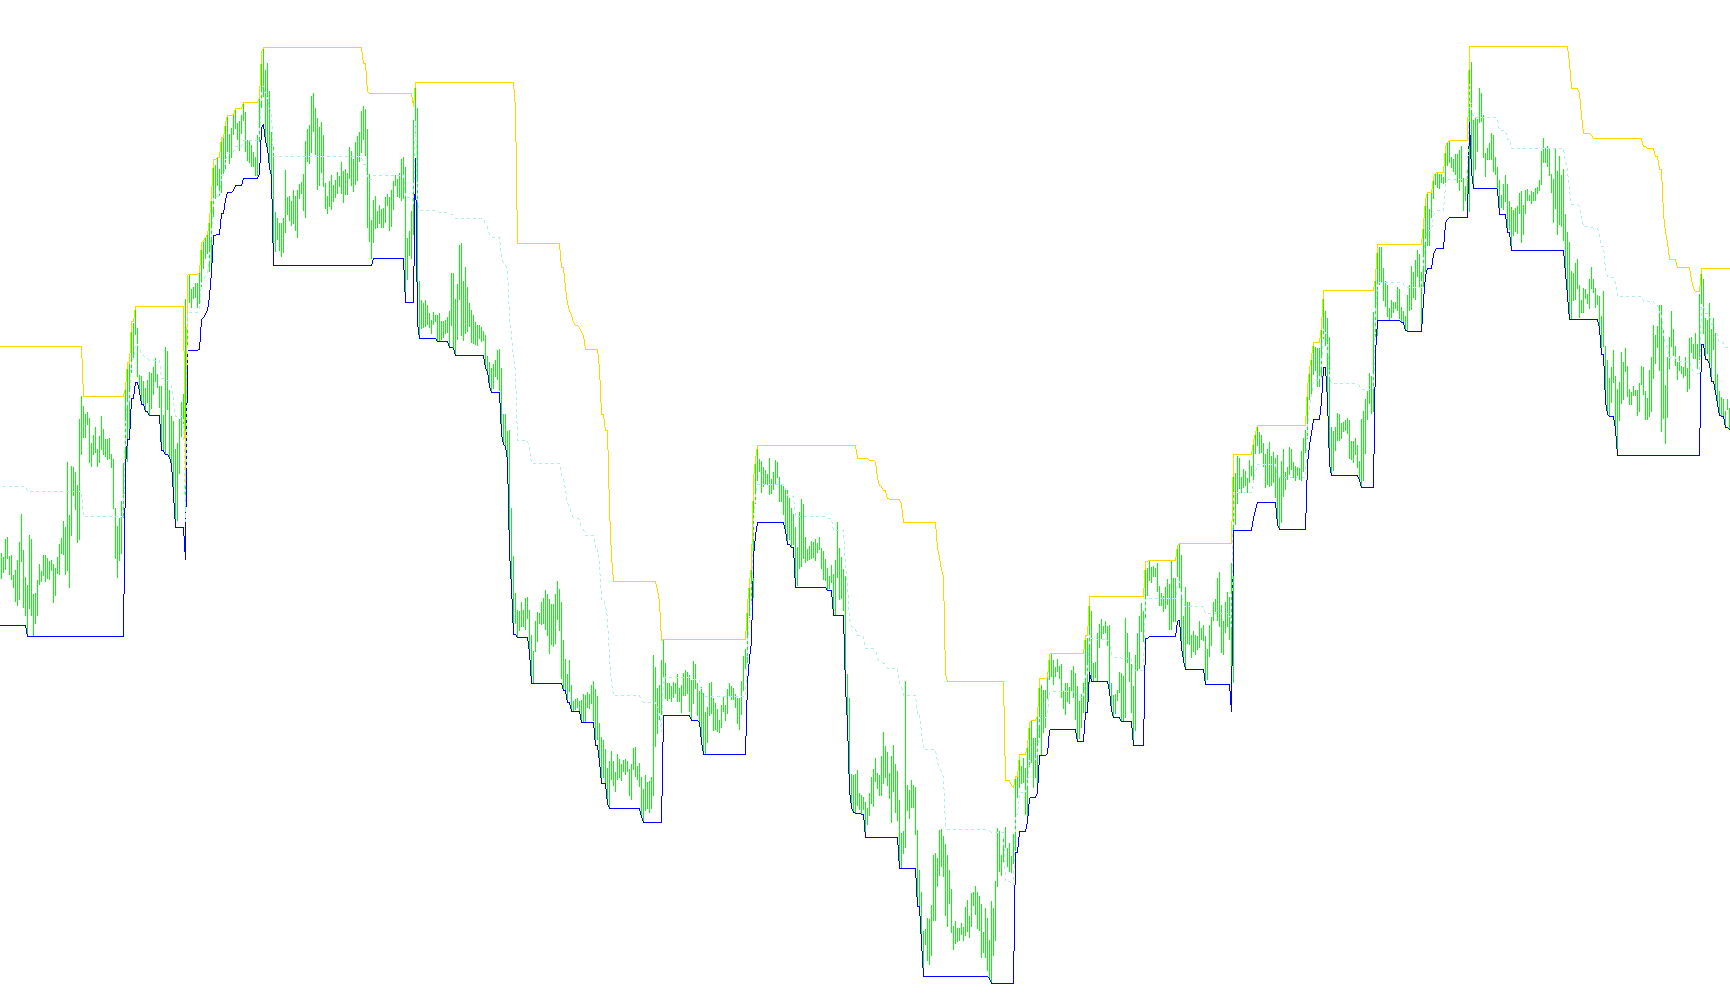
The Limited Donchian Channel is a technical analysis tool designed to help traders visualize price boundaries and volatility on a trading chart. It functions by creating a dynamic "channel" or corridor around the current market price, identifying the high and low limits within a specific timeframe.
Core Logic and Behavior
The script operates based on three primary components: an upper boundary, a lower boundary, and a middle line (the average of the two). Here is how the logic flows:
1. Dynamic Boundary Tracking The tool looks back at a user-defined number of previous price bars (the "periods"). It identifies the highest price reached and the lowest price reached during that window.
2. Expansion and Constraint Rules Unlike a standard Donchian Channel, which simply marks the absolute high and low of a period, this script includes specific rules for how these boundaries can expand:
- Price Breakouts: If the current market price breaks above the previous upper boundary or below the previous lower boundary, the channel reacts.
- Distance Limitation: The script ensures that the gap between the upper and lower boundaries does not exceed a pre-set "distance."
- Proportional Adjustment: If a new price high occurs that would make the channel wider than the allowed distance, the script automatically anchors the opposite boundary to maintain that specific width. Conversely, if the move isn't large enough to hit that distance limit, it maintains the previous boundary's position.
3. The "Fixed" Constraint The tool includes a toggle feature that determines how strictly the boundaries must hug the price action:
- When the restriction is active (defaulting to "false" in this script), the boundaries are allowed to move inward if a new high or low is formed within the period, ensuring the channel always tightly encapsulates the most recent price extremes.
4. The Middle Line At every step of the calculation, the script automatically calculates a midpoint between the upper and lower boundaries. This serves as a median value, helping traders identify the "center" of the current price range.
Summary for Traders
Essentially, this script creates a "flexible corridor." It tracks where the price has been over a set period but prevents the corridor from becoming too wide too quickly. By balancing the movement of the upper and lower lines against a fixed distance, it provides a smoothed visualization of market volatility and trend boundaries.
//+------------------------------------------------------------------+
//|                                        Limiteddonchianchanel.mq4 |
//|                        Copyright 2013, MetaQuotes Software Corp. |
//|                                        http://www.metaquotes.net |
//+------------------------------------------------------------------+
#property copyright "Copyright 2013, MetaQuotes Software Corp."
#property link      "http://www.metaquotes.net"
//---- indicator settings
#property indicator_chart_window
#property indicator_buffers 3
#property indicator_color1 Green
#property indicator_color2 Red
#property indicator_color3 DarkKhaki
#property  indicator_width1 2
#property  indicator_width2 2
#property  indicator_width3 1
//---- indicator parameters
extern int periods=50;
extern int distance=200;
extern bool fixed=false;
//---- indicator buffers
double upper[];
double lower[];
double middle[];

//+------------------------------------------------------------------+
//| Custom indicator initialization function                         |
//+------------------------------------------------------------------+
int init()
   {
//---- drawing settings
   SetIndexStyle(0,DRAW_LINE);
   SetIndexStyle(1,DRAW_LINE);
   SetIndexStyle(2,DRAW_LINE,STYLE_DOT);
//---- indicator buffers mapping
   SetIndexBuffer(0,upper);
   SetIndexBuffer(1,lower);
   SetIndexBuffer(2,middle);
//---- name for DataWindow and indicator subwindow label
   IndicatorShortName("Limited Donchian Chanel("+periods+")");
   SetIndexLabel(0,"Upper");
   SetIndexLabel(1,"Lower");
   SetIndexLabel(2,"Middle");
//---- initialization done
   return(0);
   }
//+------------------------------------------------------------------+
//| Custom indicator start function                                  |
//+------------------------------------------------------------------+
int start()
   {
   int i=Bars-IndicatorCounted();
   while(i>=0)
      {
      double u=iHigh(NULL,0,iHighest(NULL,0,MODE_HIGH,periods,i));
      double l=iLow(NULL,0,iLowest(NULL,0,MODE_LOW,periods,i));
      if(iHigh(NULL,0,i)>upper[i+1] || iLow(NULL,0,i)<lower[i+1])
         {
         if(iHigh(NULL,0,i)>upper[i+1])
            {
            upper[i]=iHigh(NULL,0,i);
            if(upper[i]-lower[i+1]>distance*Point)
               lower[i]=upper[i]-distance*Point;
            else
               lower[i]=lower[i+1];
            }
         if(iLow(NULL,0,i)<lower[i+1])
            {
            lower[i]=iLow(NULL,0,i);
            if(upper[i]-lower[i+1]>distance*Point)
               upper[i]=lower[i]+distance*Point;
            else
               upper[i]=upper[i+1];
            }
         }
      else
         {
         upper[i]=upper[i+1];
         lower[i]=lower[i+1];
         }
      if(fixed==false)
         {
         if(upper[i]>u)
            upper[i]=u;
         if(lower[i]<l)
            lower[i]=l;
         }
      middle[i]=(upper[i]+lower[i])/2;
      i--;
      }
   return(0);
   }
//+------------------------------------------------------------------+
Comments