Waddah Attar Pivot
Download script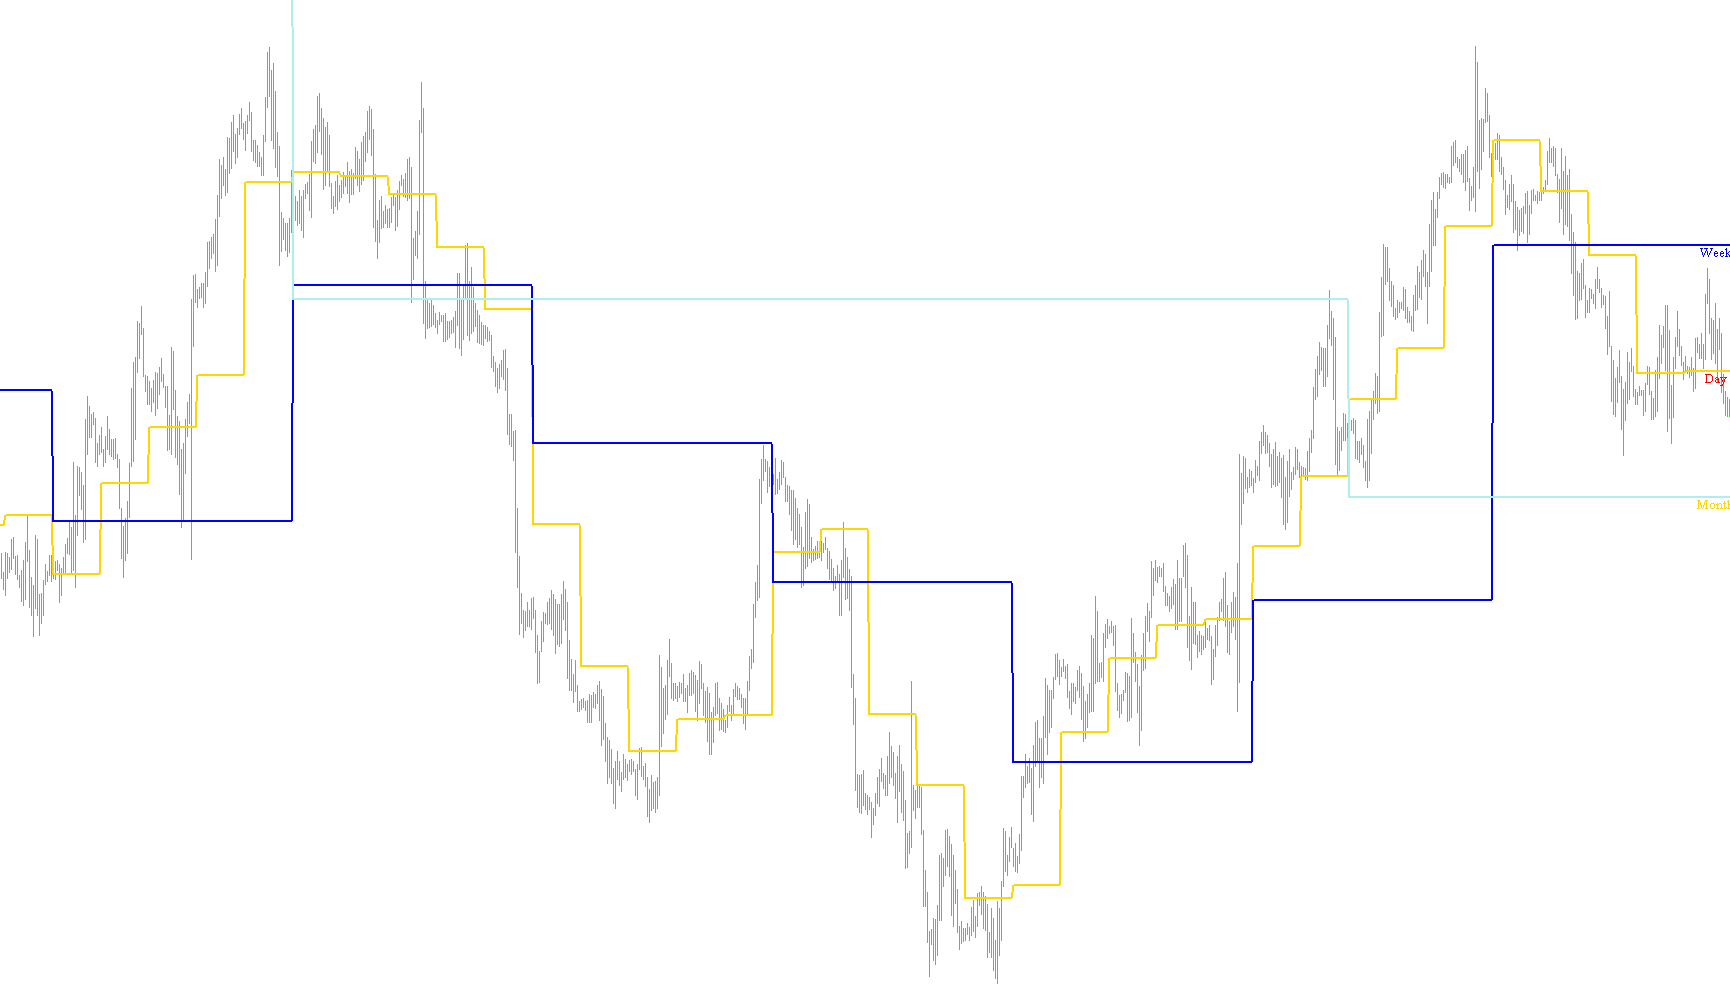
This tool is designed to provide traders with visual landmarks on their price charts by identifying key "Pivot" levels across three different timeframes: Daily, Weekly, and Monthly. By projecting these points onto the current chart, it helps users understand the broader market structure and identify significant areas of potential support or resistance.
Core Logic and Functionality
The script works by automatically calculating a specific price point based on the historical data of the previous trading period. Instead of just looking at the current moment, it analyzes the completed "candle" (the high, low, and closing prices) of the prior day, week, and month to determine where the pivot sits.
How the Calculation Works: For each timeframe, the script identifies:
- The Highest Price reached during the previous period.
- The Lowest Price reached during the previous period.
- The Closing Price of that same period.
It then takes these three values and calculates a weighted average to create a single "Pivot Point." This point represents a significant equilibrium level where the market has historically balanced itself.
Visual Representation on Your Chart
To make this information easy to read at a glance, the script creates three distinct visual elements on your chart:
- Daily Pivot: Displays the pivot level derived from the previous day's activity.
- Weekly Pivot: Displays the pivot level derived from the previous week's activity.
- Monthly Pivot: Displays the pivot level derived from the previous month's activity.
Key Visual Features:
- Color Coding: Each timeframe is assigned a unique color (Red, Blue, and Gold) so you can instantly distinguish between daily, weekly, and monthly levels.
- Labels and Markers: The script places clear text labels (e.g., "Day Pivot") directly on the chart near the corresponding price point. It also utilizes small markers to ensure the exact price level is anchored correctly to the timeline.
- Dynamic Updating: The logic automatically updates as new periods begin, ensuring that your chart always reflects the most recent historical data for accurate navigation.
Summary for the User
By using this script, you are essentially overlaying a "roadmap" of key levels on your current price action. It allows you to see where major institutional and market trends from larger timeframes intersect with your current view, helping you identify whether the price is currently trading above or below significant historical benchmarks.
//+------------------------------------------------------------------+
//|                                               Waddah Attar Pivot |
//|                        Copyright © 2007, waddahattar@hotmail.com |
//|                             Waddah Attar waddahattar@hotmail.com |
//+------------------------------------------------------------------+
#property copyright "Copyright © 2007, waddahattar@hotmail.com"
#property link      "waddahattar@hotmail.com"
//----
#property indicator_chart_window
#property indicator_buffers 3
#property indicator_color1 Red
#property indicator_color2 Blue
#property indicator_color3 Gold
//---- buffers
double P1Buffer[];
double P2Buffer[];
double P3Buffer[];
//----
double PP, Q;
//+------------------------------------------------------------------+
//| Custom indicator initialization function                         |
//+------------------------------------------------------------------+
int init()
  {
   SetIndexBuffer(0, P1Buffer);
   SetIndexBuffer(1, P2Buffer);
   SetIndexBuffer(2, P3Buffer);
//----
   SetIndexStyle(0, DRAW_LINE, STYLE_SOLID, 2);
   SetIndexStyle(1, DRAW_LINE, STYLE_SOLID, 2);
   SetIndexStyle(2, DRAW_LINE, STYLE_SOLID, 2);
//----
   Comment("Waddah Attar Pivot");
   return(0);
  }
//+------------------------------------------------------------------+
//| Custor indicator deinitialization function                       |
//+------------------------------------------------------------------+
int deinit()
  {
   ObjectDelete("DayP");
   ObjectDelete("WeekP");
   ObjectDelete("MonthP");
   ObjectDelete("txtDayP");
   ObjectDelete("txtWeekP");
   ObjectDelete("txtMonthP");

   Comment("");
   return(0);
  }
//+------------------------------------------------------------------+
//| Custom indicator iteration function                              |
//+------------------------------------------------------------------+
int start()
  {
   int i, dayi, counted_bars = IndicatorCounted();
//---- check for possible errors
   if(counted_bars < 0)
       return(-1);
//---- last counted bar will be recounted
   if(counted_bars > 0)
       counted_bars--;
   int limit = Bars - counted_bars;
//----
   for(i = limit - 1; i >= 0; i--)
     {
       dayi = iBarShift(Symbol(), PERIOD_D1, Time[i], false);
       Q = (iHigh(Symbol(), PERIOD_D1,dayi + 1) - iLow(Symbol(), PERIOD_D1, dayi + 1));
       PP = (iHigh(Symbol(), PERIOD_D1, dayi + 1) + iLow(Symbol(), PERIOD_D1, dayi + 1) + iClose(Symbol(), PERIOD_D1, dayi + 1)) / 3;
       //----
       P1Buffer[i] = PP;
       SetPrice("DayP", Time[i], PP, indicator_color1);
       SetText("txtDayP", "Day Pivot", Time[i], PP, indicator_color1);

       dayi = iBarShift(Symbol(), PERIOD_W1, Time[i], false);
       Q = (iHigh(Symbol(), PERIOD_W1,dayi + 1) - iLow(Symbol(), PERIOD_W1, dayi + 1));
       PP = (iHigh(Symbol(), PERIOD_W1, dayi + 1) + iLow(Symbol(), PERIOD_W1, dayi + 1) + iClose(Symbol(), PERIOD_W1, dayi + 1)) / 3;
       //----
       P2Buffer[i] = PP;
       SetPrice("WeekP", Time[i], PP, indicator_color2);
       SetText("txtWeekP", "Week Pivot", Time[i], PP, indicator_color2);

       dayi = iBarShift(Symbol(), PERIOD_MN1, Time[i], false);
       Q = (iHigh(Symbol(), PERIOD_MN1,dayi + 1) - iLow(Symbol(), PERIOD_MN1, dayi + 1));
       PP = (iHigh(Symbol(), PERIOD_MN1, dayi + 1) + iLow(Symbol(), PERIOD_MN1, dayi + 1) + iClose(Symbol(), PERIOD_MN1, dayi + 1)) / 3;
       //----
       P3Buffer[i] = PP;
       SetPrice("MonthP", Time[i], PP, indicator_color3);
       SetText("txtMonthP", "Month Pivot", Time[i], PP, indicator_color3);

    }
//----
   return(0);
  }
//+------------------------------------------------------------------+
//|                                                                  |
//+------------------------------------------------------------------+
void SetPrice(string name, datetime Tm, double Prc, color clr)
  {
   if(ObjectFind(name) == -1)
     {
       ObjectCreate(name, OBJ_ARROW, 0, Tm, Prc);
       ObjectSet(name, OBJPROP_COLOR, clr);
       ObjectSet(name, OBJPROP_WIDTH, 1);
       ObjectSet(name, OBJPROP_ARROWCODE, SYMBOL_RIGHTPRICE);
     }
   else
     {
       ObjectSet(name, OBJPROP_TIME1, Tm);
       ObjectSet(name, OBJPROP_PRICE1, Prc);
       ObjectSet(name, OBJPROP_COLOR, clr);
       ObjectSet(name, OBJPROP_WIDTH, 1);
       ObjectSet(name, OBJPROP_ARROWCODE, SYMBOL_RIGHTPRICE);
     }
  }
//+------------------------------------------------------------------+
//|                                                                  |
//+------------------------------------------------------------------+
void SetText(string name, string txt, datetime Tm, double Prc, color clr)
  {
   if(ObjectFind(name) == -1)
     {
       ObjectCreate(name, OBJ_TEXT, 0, Tm, Prc);
       ObjectSetText(name, txt, 10, "Times New Roman", clr);
       ObjectSet(name, OBJPROP_CORNER, 2);
     }
   else
     {
       ObjectSet(name, OBJPROP_TIME1, Tm);
       ObjectSet(name, OBJPROP_PRICE1, Prc);
       ObjectSetText(name, txt, 10, "Times New Roman", clr);
       ObjectSet(name, OBJPROP_CORNER, 2);
     }
  }
//+------------------------------------------------------------------+
Comments