VSAdiv
Download script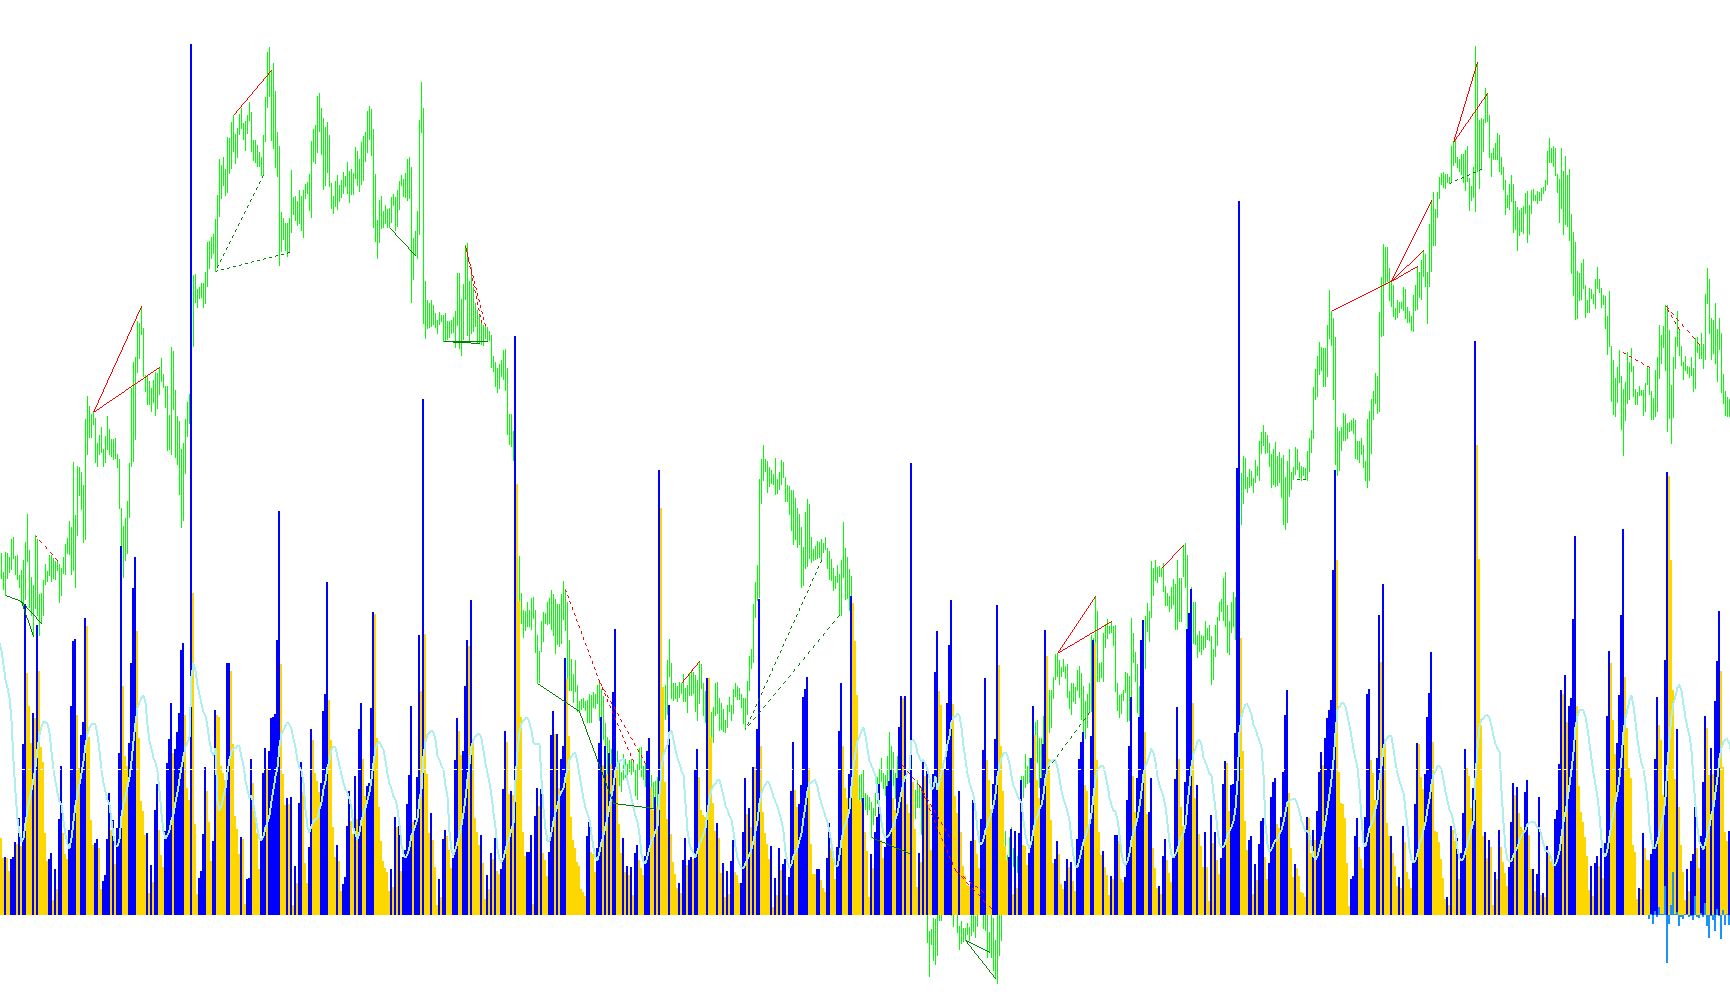
This tool is a multi-layered technical analysis indicator designed to help traders visualize market activity by combining volume data, trend momentum, and price divergence. It provides a comprehensive look at the "health" of a market move rather than just looking at price alone.
Core Functionalities
1. Volume Dynamics & Moving Averages The primary visual component tracks trading volume through a dynamic histogram.
- Color Coding: The histogram changes color based on whether volume is increasing or decreasing compared to the previous period. This helps traders quickly identify surges in activity.
- Moving Average: A customizable moving average line runs over the volume data, smoothing out short-term spikes to show the broader trend of trading activity.
2. Volume Filter Levels The script includes an intelligent filtering system that calculates a specific "threshold" or level based on historical averages (e.g., the last 100 days). It allows users to set a percentage threshold, making it easier to identify significant volume spikes relative to long-term norms.
3. Tick Volume Analysis The tool performs a deep dive into minute-by-minute data (Tick Volume) to determine the underlying sentiment of price movements. It categorizes volume based on whether price is moving up, down, or remaining flat:
- Upward Movement: Adds volume to a positive tally.
- Downward Movement: Subtracts volume from a negative tally.
- Neutral Movement: Splits the volume between both tallies. The result is a balanced average that reveals the net "force" behind price action.
4. MACD Momentum & Divergence Detection The indicator integrates the MACD (Moving Average Convergence Divergence) logic to monitor momentum. Its most advanced feature is the automated detection of Divergences:
- Bullish/Bearish Divergence: The script automatically scans for instances where the price trend and the MACD momentum are moving in opposite directions.
- Visual Aids: When the system detects these discrepancies—which often signal a potential trend reversal or exhaustion—it automatically draws trend lines directly on your chart (Red for bearish signals, Green for bullish signals).
Summary of User Benefits
By combining these elements, the script allows you to see three things simultaneously:
- Intensity: How much trading activity is happening right now (Volume Histogram).
- Context: Is this activity normal or an outlier? (Volume Filter Level).
- Validation: Is the price movement backed by strong momentum, or is it losing steam? (MACD Divergence & Tick Volume Analysis).
//+------------------------------------------------------------------+
//|                            Volume with Custom Moving Average.mq4 |
//|                      Copyright © 2004, MetaQuotes Software Corp. |
//|                                       http://www.metaquotes.net/ |
//+------------------------------------------------------------------+
#property copyright "Copyright © 2004, MetaQuotes Software Corp. Modified RonT"
#property link      "http://www.metaquotes.net/"
//----
#property indicator_separate_window
#property indicator_buffers 8
#property indicator_color1 Red
#property indicator_color2 Green
#property indicator_color3 White
#property indicator_color4 White
#property indicator_color5 Green
#property indicator_color6 Red


// User input
extern string  Note1 = "****** Volume Settings ******";
extern string  MAMethods0 = "*** 0 = SMA, 1 = EMA ***";
extern string  MAMethods2 = "*** 2 = SMMA, 3 = LWMA ***";
extern int     MA_Period=13;
extern int     MA_Shift=0;
extern string  Note2 = "****** Filter Level ******";
extern bool    ShowFilterLevel = true;
extern int     LevelAvgDays = 100;        // Set to number of days back to calculate the level on
extern double  LevelPercentage = 90.0;    // sets the indicator level to a % of the MA of the volume average buffer
extern string separator1 = "*** MACD Settings ***";
extern int    fastEMA = 12;
extern int    slowEMA = 26;
extern int    signalSMA = 9;
extern string separator2 = "*** Indicator Settings ***";
extern bool   drawPriceTrendLines = true;


// Buffers
double VolBuffer1[];  // value down
double VolBuffer2[];  // value up
double VolBuffer3[];  // moving average
double P3Buffer[];
double bullishDivergence[];
double bearishDivergence[];
double macd[];
double signal[];
//----

double P1;
double P2;
int ExtCountedBars=0;
int lastcolor=0;
int MA_Method=0;
static string   indicatorName;
//+------------------------------------------------------------------+
//| Custom indicator initialization function                         |
//+------------------------------------------------------------------+
int init()
  {
   int    draw_begin;

   // indicator buffers mapping, drawing settings and Shift
   // Histogram downArrow Red
   SetIndexBuffer(0,VolBuffer1);
   SetIndexStyle(0,DRAW_HISTOGRAM,0,2);
   SetIndexShift(0,MA_Shift);
   // Histogram upArrow Green
   SetIndexBuffer(1,VolBuffer2);
   SetIndexStyle(1,DRAW_HISTOGRAM,0,2);
   SetIndexShift(1,MA_Shift);
   // Moving average line white
   SetIndexBuffer(2,VolBuffer3);
   SetIndexStyle(2,DRAW_LINE,0,2);
   SetIndexShift(2,MA_Shift);

   SetIndexBuffer(3, P3Buffer);
   SetIndexStyle(3, DRAW_HISTOGRAM, STYLE_SOLID, 2);


   SetIndexBuffer(4, bullishDivergence);
   SetIndexBuffer(5, bearishDivergence);
   SetIndexBuffer(6, macd);
   SetIndexStyle(6,DRAW_NONE,0,0);
   SetIndexBuffer(7, signal);
   SetIndexStyle(7,DRAW_NONE,0,0);


   IndicatorDigits(MarketInfo(Symbol(),MODE_DIGITS));
//----
   if(MA_Period<2) MA_Period=2;
   draw_begin=MA_Period-1;
//----

   indicatorName = "VSA";
   SetIndexDrawBegin(3, signalSMA);
   IndicatorDigits(Digits + 2);
   IndicatorShortName(indicatorName);

   return(0);
  }
//+------------------------------------------------------------------+
//| Custom indicator deinitialization function                       |
//+------------------------------------------------------------------+
int deinit()
  {
   for(int i = ObjectsTotal() - 1; i >= 0; i--)
     {
       string label = ObjectName(i);
       if(StringSubstr(label, 0, 19) != "MACD_DivergenceLine")
           continue;
       ObjectDelete(label);
     }
   return(0);
  }
//+------------------------------------------------------------------+
//| Main                                                             |
//+------------------------------------------------------------------+
int start()
  {
   if (ShowFilterLevel) VolumeFilterLevel();
   TickVolumeDiff();

   int countedBars = IndicatorCounted();
   if(countedBars < 0)
   countedBars = 0;
   CalculateIndicator(countedBars);

   if(Bars<=MA_Period) return(0);
   ExtCountedBars=IndicatorCounted();
   // check for possible errors
   if (ExtCountedBars<0) return(-1);
   // last counted bar will be recounted
   if (ExtCountedBars>0) ExtCountedBars--;
   switch(MA_Method)
     {
      case 0 : sma();
     }
   return(0);
  }

//+------------------------------------------------------------------+
//| Simple Moving Average                                            |
//+------------------------------------------------------------------+
void sma()
  {
   double sum=0;
   int    i,pos=Bars-ExtCountedBars-1;
   // initial accumulation
   if(pos<MA_Period) pos=MA_Period;
   for(i=1;i<MA_Period;i++,pos--)
      sum+=Volume[pos];
   while(pos>=0)
     {
      sum+=Volume[pos];
      VolBuffer3[pos]=sum/MA_Period;
      sum-=Volume[pos+MA_Period-1];
      Vcolor(pos);
      pos--;
     }
   // zero initial bars
   if(ExtCountedBars<1)
      for(i=1;i<MA_Period;i++) VolBuffer1[Bars-i]=0;
  }

//+------------------------------------------------------------------+
//|Color depends on gain or loss and previous volume                 |
// 1 - histo down red                                                |
// 2 - histo up green                                                |
// 3 - line white                                                    |
//+------------------------------------------------------------------+

void Vcolor(int p)
  {
   if (Volume[p+1]>Volume[p])
     {
      VolBuffer1[p]=Volume[p];
      VolBuffer2[p]=0;
      lastcolor=Red;
     }
   if (Volume[p+1]<Volume[p])
     {
      VolBuffer1[p]=0;
      VolBuffer2[p]=Volume[p];
      lastcolor=Green;
     }
   if (Volume[p+1]==Volume[p])
     {
      if(lastcolor==Red )
        {
         VolBuffer1[p]=Volume[p];
         VolBuffer2[p]=0;
        }
      if(lastcolor==Green )
        {
         VolBuffer1[p]=0;
         VolBuffer2[p]=Volume[p];
        }
     }
  }

//+------------------------------------------------------------------+
//| VolumeFilterLevel()                                              |
//+------------------------------------------------------------------+
void VolumeFilterLevel()
{
   int LevelMAPeriod;
   string short_name;

   if (LevelAvgDays == (-1)) LevelMAPeriod = Bars;
   else
   {
      switch(Period())
      {
         case 1:        LevelMAPeriod = LevelAvgDays*(1440); break;
         case 5:        LevelMAPeriod = LevelAvgDays*(1440/5); break;
         case 15:       LevelMAPeriod = LevelAvgDays*(1440/15); break;
         case 30:       LevelMAPeriod = LevelAvgDays*(1440/30); break;
         case 60:       LevelMAPeriod = LevelAvgDays*(1440/60); break;
         case 240:      LevelMAPeriod = LevelAvgDays*(1440/240); break;
         case 1440:     LevelMAPeriod = LevelAvgDays; break;
         default :      LevelMAPeriod = Bars;
      }
   }
   double MyBuffer[];
   int BufSize = ArraySize(VolBuffer3);
   ArrayResize(MyBuffer,BufSize);
   ArrayCopy(MyBuffer,VolBuffer3);
   SetLevelValue(0,0);
   SetLevelStyle(0,0,CLR_NONE);
   ObjectDelete("MAofVolLev");
   double LevValue = 0;
   LevValue = MathRound(VolBuffer3[0]) * (LevelPercentage/100);
   SetLevelValue(0,LevValue);
   SetLevelStyle(2,1,Gray);
   int IntLevelValue = LevValue;
   ObjectCreate("MAofVolLev", OBJ_LABEL, WindowFind("VSA"), 0, 0);
   ObjectSetText("MAofVolLev","VSA & VolDiv (FOREXflash 2009)",8, "Arial", Gray);
   ObjectSet("MAofVolLev", OBJPROP_CORNER, 1);
   ObjectSet("MAofVolLev", OBJPROP_XDISTANCE, 5);
   ObjectSet("MAofVolLev", OBJPROP_YDISTANCE, 5);
}
//+------------------------------------------------------------------+
void TickVolumeDiff()
  {

   int i,ii;
   static int pii=-1;

   for(i = 0; i <iBars(Symbol(),PERIOD_M1) ; i++)
     {
       ii = iBarShift(Symbol(), Period(), iTime(Symbol(),PERIOD_M1,i), true);
       //----
       if (pii!=ii)
       {
         P1=0;
         P2=0;
         P3Buffer[ii]=0;
       }

       if (ii != -1)
       {
         if (iClose(Symbol(),PERIOD_M1,i)>iClose(Symbol(),PERIOD_M1,i+1))
         {
           P1 = P1+(iVolume(Symbol(),PERIOD_M1,i));
         }
         if (iClose(Symbol(),PERIOD_M1,i)<iClose(Symbol(),PERIOD_M1,i+1))
         {
           P2 = P2-(iVolume(Symbol(),PERIOD_M1,i));
         }
         if (iClose(Symbol(),PERIOD_M1,i)==iClose(Symbol(),PERIOD_M1,i+1))
         {
           P1 = P1+(iVolume(Symbol(),PERIOD_M1,i)/2);
           P2 = P2-(iVolume(Symbol(),PERIOD_M1,i)/2);
         }
       }

       P3Buffer[ii]=(P1+P2)/2;

       pii=ii;
    }
//----
   return(0);
  }
//+------------------------------------------------------------------+
//|                                                                  |
//+------------------------------------------------------------------+
void CalculateIndicator(int countedBars)
  {
   for(int i = Bars - countedBars; i >= 0; i--)
     {
       CalculateMACD(i);
       CatchBullishDivergence(i + 2);
       CatchBearishDivergence(i + 2);
     }
  }
//+------------------------------------------------------------------+
//|                                                                  |
//+------------------------------------------------------------------+
void CalculateMACD(int i)
  {
   macd[i] = iMACD(NULL, 0, fastEMA, slowEMA, signalSMA,
                   PRICE_CLOSE, MODE_MAIN, i);

   signal[i] = Volume[i];
  }
//+------------------------------------------------------------------+
//|                                                                  |
//+------------------------------------------------------------------+
void CatchBullishDivergence(int shift)
  {
   if(IsIndicatorTrough(shift) == false)
       return;
   int currentTrough = shift;
   int lastTrough = GetIndicatorLastTrough(shift);
//----
   if(macd[currentTrough] > macd[lastTrough] &&
      Low[currentTrough] < Low[lastTrough])
     {

       //----
       if(drawPriceTrendLines == true)
           DrawPriceTrendLine(Time[currentTrough], Time[lastTrough],
                              Low[currentTrough],
                             Low[lastTrough], Green, STYLE_SOLID);
     }
//----
   if(macd[currentTrough] < macd[lastTrough] &&
      Low[currentTrough] > Low[lastTrough])
     {

       if(drawPriceTrendLines == true)
           DrawPriceTrendLine(Time[currentTrough], Time[lastTrough],
                              Low[currentTrough],
                              Low[lastTrough], Green, STYLE_DOT);
     }
  }
//+------------------------------------------------------------------+
//|                                                                  |
//+------------------------------------------------------------------+
void CatchBearishDivergence(int shift)
  {
   if(IsIndicatorPeak(shift) == false)
       return;
   int currentPeak = shift;
   int lastPeak = GetIndicatorLastPeak(shift);
//----
   if(macd[currentPeak] < macd[lastPeak] &&
      High[currentPeak] > High[lastPeak])
     {


       if(drawPriceTrendLines == true)
           DrawPriceTrendLine(Time[currentPeak], Time[lastPeak],
                              High[currentPeak],
                              High[lastPeak], Red, STYLE_SOLID);

     }
   if(macd[currentPeak] > macd[lastPeak] &&
      High[currentPeak] < High[lastPeak])
     {

       if(drawPriceTrendLines == true)
           DrawPriceTrendLine(Time[currentPeak], Time[lastPeak],
                              High[currentPeak],
                              High[lastPeak], Red, STYLE_DOT);
     }
  }
//+------------------------------------------------------------------+
//|                                                                  |
//+------------------------------------------------------------------+
bool IsIndicatorPeak(int shift)
  {
   if(macd[shift] >= macd[shift+1] && macd[shift] > macd[shift+2] &&
      macd[shift] > macd[shift-1])
       return(true);
   else
       return(false);
  }
//+------------------------------------------------------------------+
//|                                                                  |
//+------------------------------------------------------------------+
bool IsIndicatorTrough(int shift)
  {
   if(macd[shift] <= macd[shift+1] && macd[shift] < macd[shift+2] &&
      macd[shift] < macd[shift-1])
       return(true);
   else
       return(false);
  }
//+------------------------------------------------------------------+
//|                                                                  |
//+------------------------------------------------------------------+
int GetIndicatorLastPeak(int shift)
  {
   for(int i = shift + 5; i < Bars; i++)
     {
       if(signal[i] >= signal[i+1] && signal[i] >= signal[i+2] &&
          signal[i] >= signal[i-1] && signal[i] >= signal[i-2])
         {
           for(int j = i; j < Bars; j++)
             {
               if(macd[j] >= macd[j+1] && macd[j] > macd[j+2] &&
                  macd[j] >= macd[j-1] && macd[j] > macd[j-2])
                   return(j);
             }
         }
     }
   return(-1);
  }
//+------------------------------------------------------------------+
//|                                                                  |
//+------------------------------------------------------------------+
int GetIndicatorLastTrough(int shift)
  {
    for(int i = shift + 5; i < Bars; i++)
      {
        if(signal[i] <= signal[i+1] && signal[i] <= signal[i+2] &&
           signal[i] <= signal[i-1] && signal[i] <= signal[i-2])
          {
            for (int j = i; j < Bars; j++)
              {
                if(macd[j] <= macd[j+1] && macd[j] < macd[j+2] &&
                   macd[j] <= macd[j-1] && macd[j] < macd[j-2])
                    return(j);
              }
          }
      }
    return(-1);
  }
//+------------------------------------------------------------------+
//|                                                                  |
//+------------------------------------------------------------------+
void DrawPriceTrendLine(datetime x1, datetime x2, double y1,
                        double y2, color lineColor, double style)
  {
   string label = "MACD_DivergenceLine_v1.0# " + DoubleToStr(x1, 0);
   ObjectDelete(label);
   ObjectCreate(label, OBJ_TREND, 0, x1, y1, x2, y2, 0, 0);
   ObjectSet(label, OBJPROP_RAY, 0);
   ObjectSet(label, OBJPROP_COLOR, lineColor);
   ObjectSet(label, OBJPROP_STYLE, style);
  }

//+------------------------------------------------------------------+
Comments