VSI
Download script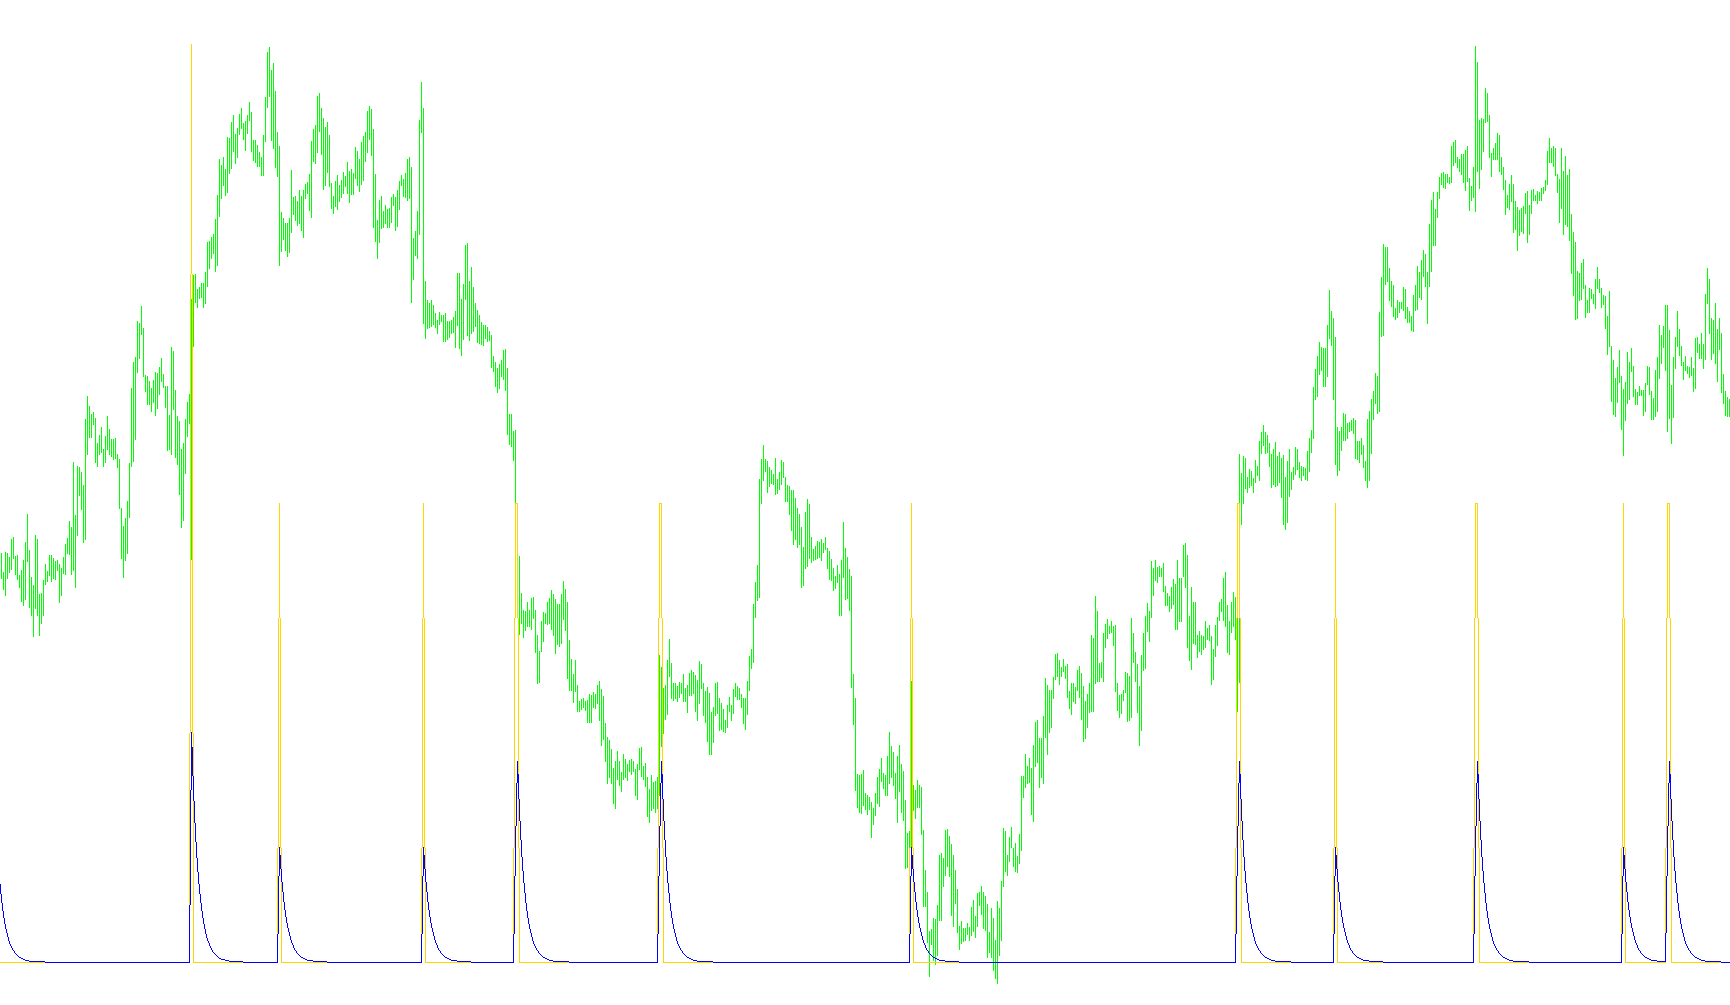
Overview
The VSI (Volume per Second) indicator is designed to help traders understand the intensity of trading activity by normalizing volume data. In standard trading platforms, "volume" typically represents the total amount traded during a specific timeframe (e.g., an hour or a day). This can make it difficult to compare activity across different charts because a 1-hour bar will naturally have much higher volume than a 5-minute bar. This script solves that problem by breaking down the volume into a "per second" metric.
Core Logic and Functionality
The indicator operates based on three primary logical steps:
1. Volume Normalization (Volume per Second)
Instead of showing you the total volume of a candle, the script calculates how much volume occurred every single second within that timeframe. It does this by taking the total volume of a period and dividing it by the number of seconds in that period.
By converting the data into "volume per second," the indicator creates a uniform standard. This allows you to compare the speed and intensity of market activity across different chart types (such as switching from a 15-minute chart to a 4-hour chart) without the data being skewed by the length of the candle.
2. Real-Time Adjustment
The script includes a specific logic branch to handle the "current" live candle. Because the current bar is still in progress, its total duration isn't finalized yet. The indicator intelligently calculates the volume for the current active moment by measuring the time elapsed since the bar started, ensuring the data remains accurate and fluid as new prices come in.
3. Moving Average Smoothing
To make the data easier to read and identify trends, the script applies a Moving Average (MA) to the calculated volume-per-second values. This smooths out the "noise" of rapid price fluctuations, allowing you to see the underlying momentum of the market more clearly. Users can choose different types of moving averages (such as Simple, Exponential, or Weighted) depending on how reactive they want the line to be.
Key Settings and Usage
- Timeframe Compatibility: The developer notes that this tool is most effective on charts ranging from 15 minutes to 4 hours. Very short periods (like 1 minute) may produce "jittery" results, while daily charts may show inconsistencies due to how the platform handles partial days.
- Comparison Modes: You can choose to view the data as raw "Volume per Second" or scale it back up to the "Volume per Chart Period." While the second option makes the numbers larger, the "per second" mode is the primary logic used to maintain consistency across different timeframes.
- Visual Output: The indicator displays two main lines: the actual volume-per-second data and the smoothed moving average line, providing a clear picture of whether trading intensity is accelerating or decelerating.
/*
 * Filename:    VSI.mq4
 * Author:      DriverDan
 * Date:        Oct 20, 2005
 *
 * Description: Indicator that calculates volume per second (or period) and the corresponding MA.
 *              Uses volume per second since it will be uniform for all chart periods.
 *              Indicator seems to work best on 15m to 4h charts. IMHO, 1m and 5m periods are
 *              too short for valid results and 1d+ will show low periods for partial days on MT4.
 *
 * Version:     1.0
 *              Initial release
 */

#property copyright         "Copyright © 2005, DriverDan"
#property link              "superfunman2000@yahoo.com"

#property indicator_separate_window
#property indicator_minimum 0
#property indicator_buffers 2
#property indicator_color1  DodgerBlue
#property indicator_color2  Red

#define    SECINMIN         60  //Number of seconds in a minute

extern int vsiMAPeriod    = 7;  //Period for the moving average.
extern int vsiMAType      = 1;  //Moving average type. 0 = SMA, 1 = EMA, 2 = SMMA, 3 = LWMA
extern int showPerPeriod  = 0;  //0 = volume per second, 1 = volume per chart period
                                /* Volume per second allows you to compare values for different
                                   chart periods. Otherwise the values it will show will only be
                                   valid for the chart period you are viewing. The graph will
                                   look exactly the same but the values will be different. */

double vsiBuffer[];
double vsiMABuffer[];

/**
 * Initialization function
 */
int init() {
   string vsiTitle = "VSI(" + vsiMAPeriod + ")";
   SetIndexStyle(0,DRAW_LINE);
   SetIndexStyle(1,DRAW_LINE);
   SetIndexBuffer(0, vsiBuffer);
   SetIndexBuffer(1, vsiMABuffer);
   IndicatorShortName(vsiTitle);
   SetIndexLabel(0, vsiTitle);
   SetIndexLabel(1, "vsiMA(" + vsiMAPeriod + ")");
   SetIndexDrawBegin(1, vsiMAPeriod);
   return(0);
}

/**
 * Main program
 */
int start() {
   int i, limit, timeDiff;
   int counted_bars = IndicatorCounted();

   if(counted_bars >= 0) {

      //If counted bars is greater than zero we must subtract 1 so we get in the right position
      if(counted_bars > 0) {
         counted_bars--;
      }

      //Only count bars we haven't already drawn
      limit = Bars - counted_bars;

      for(i = 0; i < limit; i++) {
         //Difference between the current time and the bar start
         timeDiff = CurTime() - Time[i];

         //If we are in the current bar and the tick doesn't fall exactly on the '00:00' min & sec
         if(i == 0 && timeDiff > 0) {
            vsiBuffer[i] = Volume[i] / timeDiff;
         } else {
            //Otherwise calculate the total bar volume divided by the total bar seconds
            vsiBuffer[i] = Volume[i] / (Time[i - 1] - Time[i]);
         }

         if(showPerPeriod == 1) {
            vsiBuffer[i] = vsiBuffer[i] * Period() * SECINMIN;
         }
      }

      //Fill the moving average buffer
      for(i = 0; i < limit; i++) {
         vsiMABuffer[i] = iMAOnArray(vsiBuffer, Bars, vsiMAPeriod, 0, vsiMAType, i);
      }
   }

   return(0);
}
Comments