VSpread2
Download script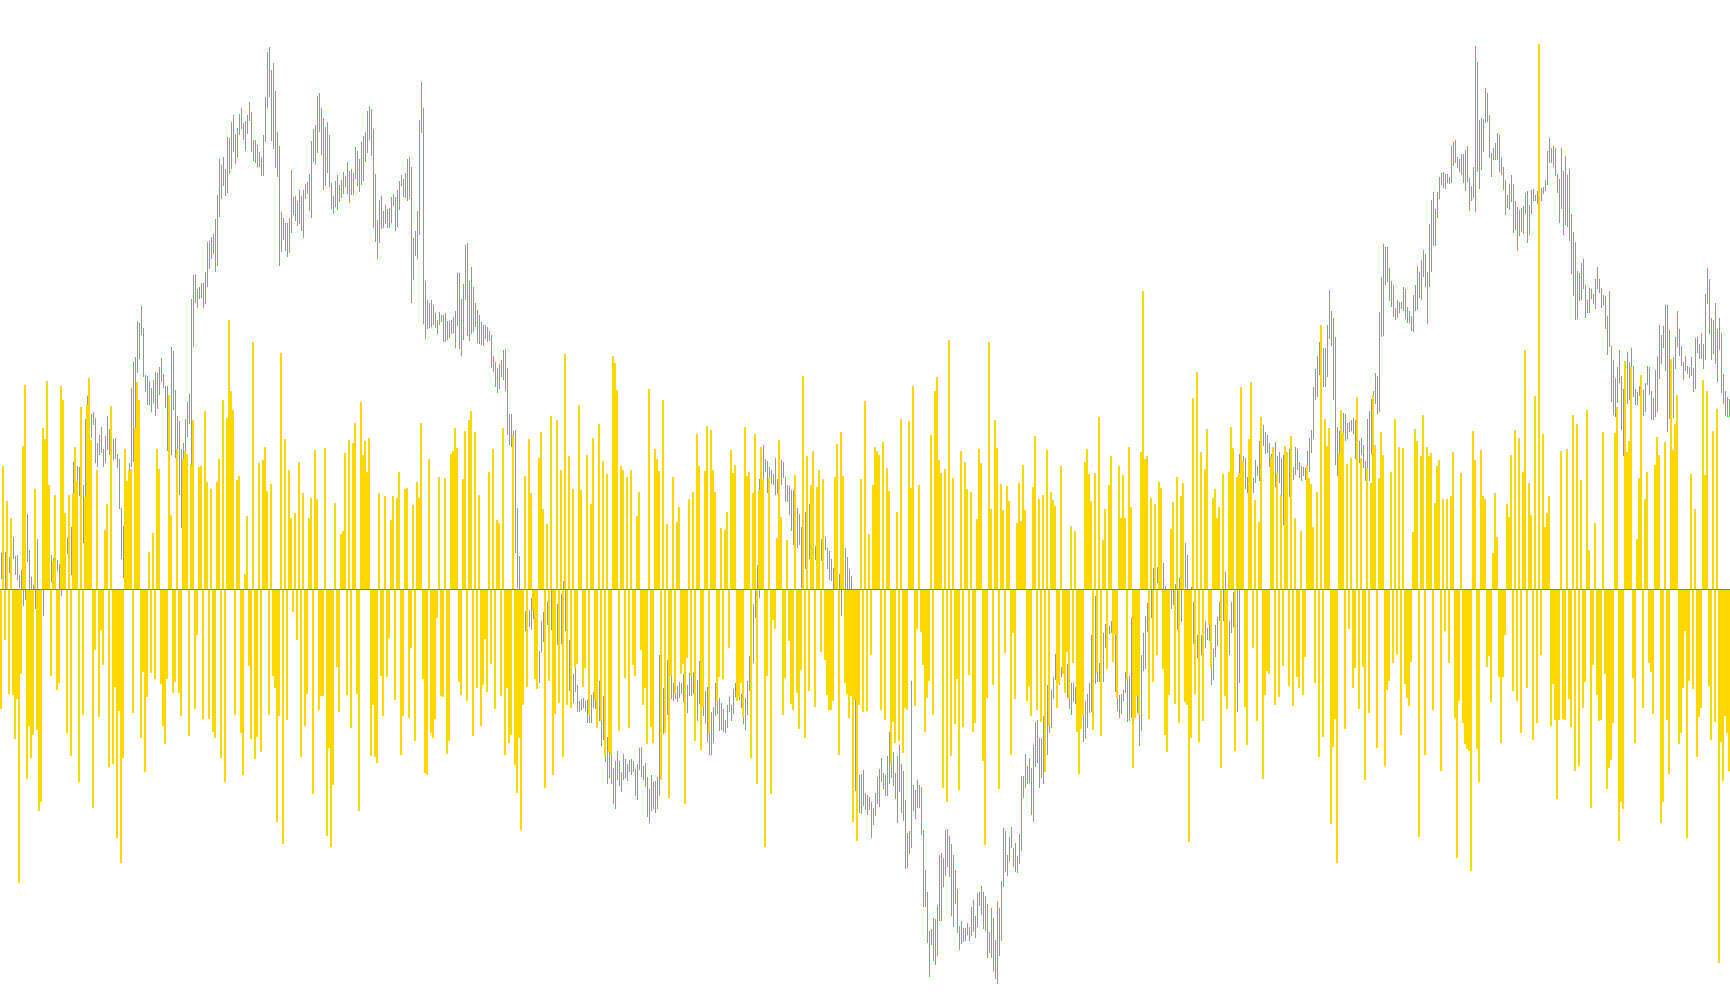
This tool is designed to provide traders with a specialized visual representation of market activity by analyzing the relationship between trading volume and price movement. Instead of looking at raw numbers, it interprets how much "effort" is being exerted by market participants to move the price in specific directions.
Core Logic Overview
The script functions by examining every historical candle on your chosen timeframe to determine whether buying pressure or selling pressure is dominant. It calculates this by looking at three key factors:
- Volume Magnitude: The total amount of trading activity occurring during a specific period.
- Price Direction: Whether the price closed higher or lower than it was in the previous candle.
- Relative Range: The distance between the highest and lowest prices reached during that candle.
How the Analysis Works
The script processes data through a series of logical steps to create its visual output:
- Pressure Identification: For every price movement, the logic calculates the "pressure" by dividing the total volume by the size of the price range (the distance from high to low). This helps distinguish between aggressive moves and sluggish movements where high volume yields little price progress.
- Directional Sentiment:
- If the price increases, the script treats the calculated pressure as positive (buying sentiment).
- If the price decreases, it treats the calculated pressure as negative (selling sentiment).
- Momentum Smoothing: The logic continuously updates these values candle-by-candle. If a candle shows no significant change in volume or volatility compared to the previous one, the script resets the current calculation to ensure the data remains relevant and doesn't carry over "stale" information from old movements.
- Visual Output: The final result is rendered as a dynamic histogram. By viewing this, you can see the cumulative flow of momentum, allowing you to identify whether the market is being pushed by strong conviction or if the current trend is losing its underlying strength.
Summary for the User
In essence, this script translates "Volume" into "Market Effort." It allows you to see at a glance whether the current price action is backed by significant trading activity or if the market is moving on low participation, helping you better understand the strength behind each trend.
//+------------------------------------------------------------------+
//|                                     VSA        mich99@o2.pl      |
//+------------------------------------------------------------------+
#property copyright ""
#property link      ""
//----
#property indicator_separate_window
#property indicator_buffers 4
#property indicator_color1 Blue
#property indicator_color2 Red
#property indicator_color3 Blue
#property indicator_color4 White


#property indicator_level1 0

extern int TimeFrame = 0;


//---- buffers
double P1;
double P2;
double K1;
double K2;
double S1;
double S2;
double D1;
double D2;

double P1Buffer[];
double P2Buffer[];
double P3Buffer[];
double P4Buffer[];


//----
//+------------------------------------------------------------------+
//| Custom indicator initialization function                         |
//+------------------------------------------------------------------+
int init()
  {
   SetIndexBuffer(0, P1Buffer);
   SetIndexBuffer(1, P2Buffer);
   SetIndexBuffer(2, P3Buffer);
   SetIndexBuffer(3, P4Buffer);

//----
   SetIndexStyle(0, DRAW_HISTOGRAM, STYLE_SOLID, 3);
   SetIndexStyle(1, DRAW_LINE, STYLE_SOLID, 1);
   SetIndexStyle(2, DRAW_HISTOGRAM, STYLE_SOLID, 4);

   SetIndexStyle(3, DRAW_LINE, STYLE_SOLID, 1);

   IndicatorShortName("Vol/Spr("+TimeFrame+")");
//----
   IndicatorDigits(1);

   Comment(" Are You identifying Yourself with Your mind? ");
   return(0);
  }
//+------------------------------------------------------------------+
//| Custor indicator deinitialization function                       |
//+------------------------------------------------------------------+
int deinit()
  {
   Comment("");
   return(0);
  }
//+------------------------------------------------------------------+
//| Custom indicator iteration function                              |
//+------------------------------------------------------------------+
int start()
  {

   int i,ii;
   static int pii=-1;

   for(i = 0; i <3000 ; i++)//iBars(Symbol(),TimeFrame)
     {
       ii = iBarShift(Symbol(), Period(), iTime(Symbol(),TimeFrame,i), true);
       //----
       if (pii!=ii)
       {
         P1=0;
         P2=0;
         K1=0;
         K2=0;
         S1=0;
         S2=0;
         D1=0;
         D2=0;


         P1Buffer[ii]=0;
         P2Buffer[ii]=0;
         P3Buffer[ii]=0;
         P4Buffer[ii]=0;

       }

       if (ii != -1)
       {
         if (iVolume(Symbol(),TimeFrame,i)>0 && iClose(Symbol(),TimeFrame,i)-iClose(Symbol(),TimeFrame,i+1)>0)
         {
           P1 = P1+iVolume(Symbol(),TimeFrame,i)/((MathAbs(iHigh(Symbol(),TimeFrame,i)-iLow(Symbol(),TimeFrame,i)+0.000001))/Point);
         }

         if (iVolume(Symbol(),TimeFrame,i)>0 && iClose(Symbol(),TimeFrame,i)-iClose(Symbol(),TimeFrame,i+1)<=0 )
         {
           P2 = P2-iVolume(Symbol(),TimeFrame,i)/((MathAbs(iHigh(Symbol(),TimeFrame,i)-iLow(Symbol(),TimeFrame,i)+0.000001))/Point);//MathAbs(iClose(Symbol(),TimeFrame,i)-iClose(Symbol(),TimeFrame,i+1));High[Highest(NULL,TimeFrame,MODE_HIGH,MA_per,i)]
         }


         if (iVolume(Symbol(),TimeFrame,i)==iVolume(Symbol(),TimeFrame,i+1)   &&  iATR(Symbol(),TimeFrame, 2, i)==iATR(Symbol(),TimeFrame, 2, i+1) )
         {
           P1 = 0;//P1+(iVolume(Symbol(),TimeFrame,i)/2);
           P2 = 0;//P2-(iVolume(Symbol(),TimeFrame,i)/2);
         }
       }
       P1Buffer[ii]=P1+P2;
       P2Buffer[ii]=0;
       P3Buffer[ii]=0;
       P4Buffer[ii]=0;

       pii=ii;
    }
//----
   return(0);
  }
Comments