VSA_ TrendDiamonds
Download script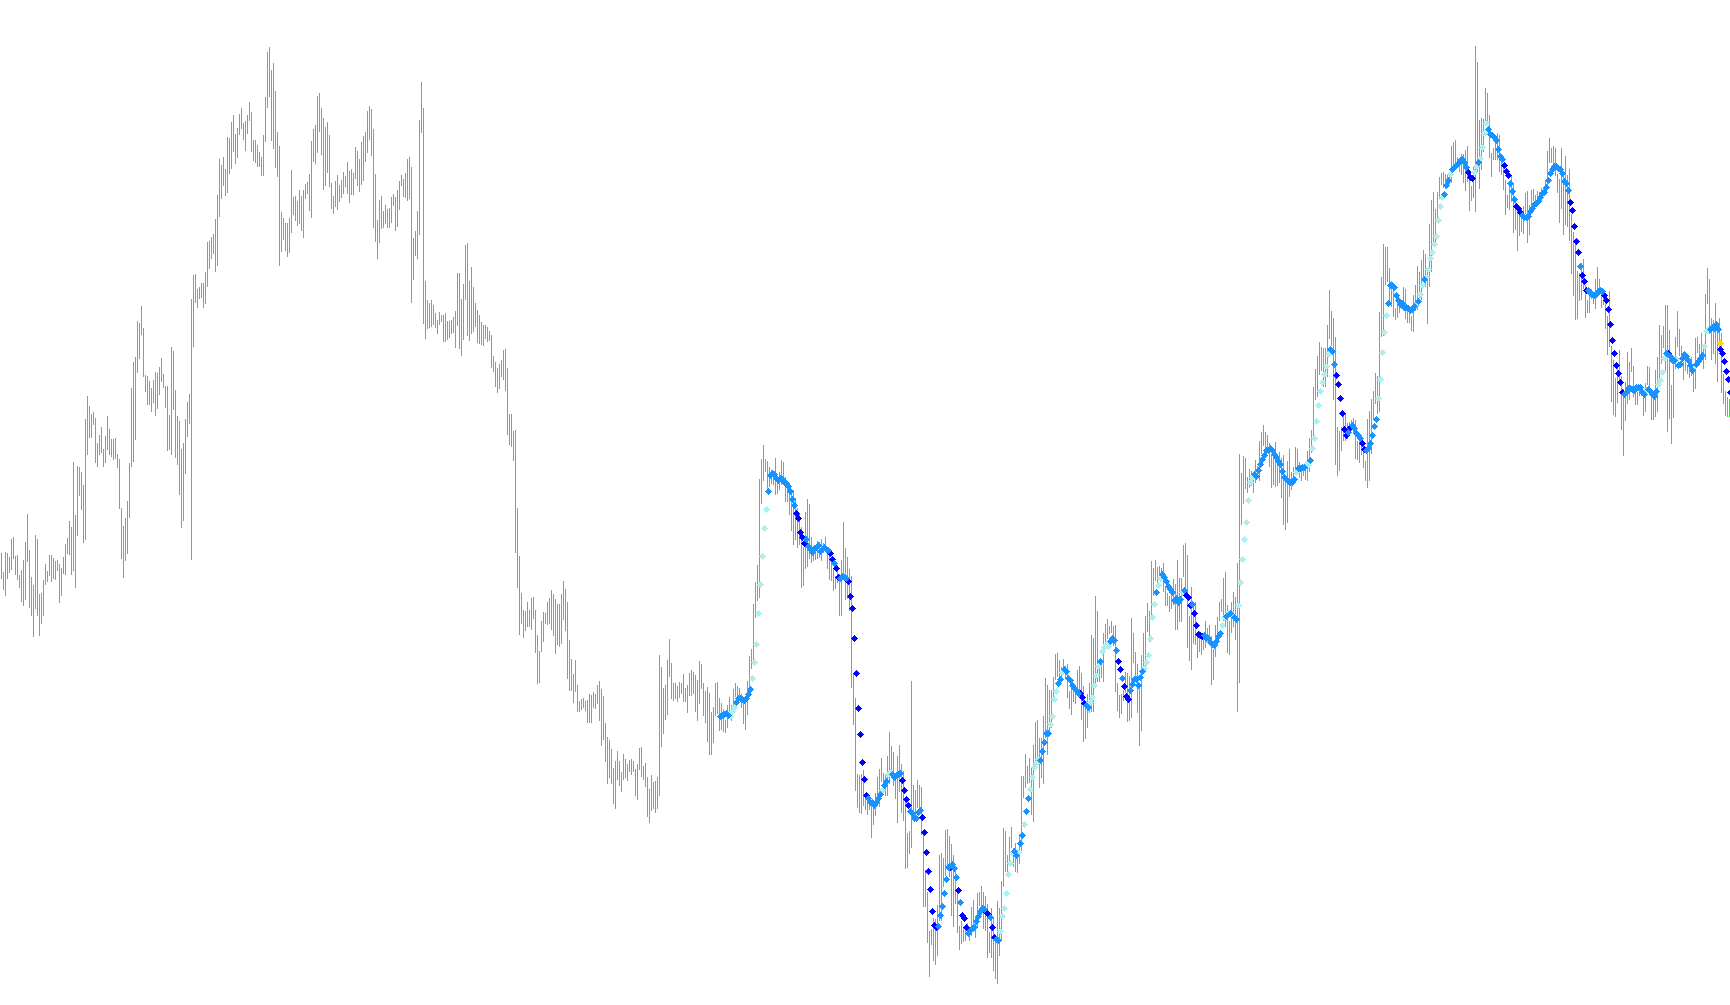
This tool is designed to help traders identify specific trend reversals and momentum shifts by analyzing multiple market indicators simultaneously. Rather than relying on a single data point, it looks for a "confluence" of conditions—where several different types of market behavior agree at the same time.
How the Logic Works
The script constantly monitors four primary types of technical data to determine the direction of the market:
1. Moving Averages (Trend Direction) The tool tracks the "average" price over a specific period. It compares the current average to the previous one to see which way the trend is leaning. If the current average is lower than the previous one, it suggests downward momentum; if higher, it suggests upward momentum.
2. Parabolic SAR (Trend Reversal) This is used as a "stop-and-reverse" filter. It calculates a dot or level that sits above or below the price. If the price moves across this level, it signals a potential change in the trend's direction. The script checks if the current price has crossed into these zones to confirm a shift.
3. Bollinger Bands (Volatility and Expansion) The tool measures the "spread" or width between the upper and lower boundaries of the market volatility. It doesn't just look at how wide the bands are, but specifically whether that width is expanding. It looks for moments where the market is becoming significantly more volatile than it was in the previous period.
Signal Generation
The script only generates a signal (an arrow on your chart) when all three of these conditions meet specific criteria:
- For a Sell Signal: The moving average must be pointing down, the price must be below the Parabolic SAR level, and the market volatility must be expanding significantly.
- For a Buy Signal: The moving average must be pointing up, the price must be above the Parabolic SAR level, and the market volatility must also be expanding significantly.
Visual Output
The indicator identifies these "high-probability" moments by placing arrows on your chart. If none of the specific buy or sell conditions are met, the tool remains neutral, helping you distinguish between active trading opportunities and periods where the market is simply moving without enough strength to justify a trade.
//+------------------------------------------------------------------+
//|                                           VSA© TrendDiamonds.mq4 |
//|                                    Copyright © 2008, FOREXflash. |
//|                                        http://www.metaquotes.net |
//+------------------------------------------------------------------+
#property copyright "Copyright © 2008, FOREXflash Software Corp."
#property link      "http://www.metaquotes.net"
//----
#property indicator_chart_window
#property indicator_buffers 4

#property indicator_color1 Black
#property indicator_color2 Red
#property indicator_color3 Lime
#property indicator_color4 White

#property indicator_width1 2
#property indicator_width2 1
#property indicator_width3 1
#property indicator_width4 1

extern int period_ma=5;
extern int method_=MODE_SMMA;
extern int price_=PRICE_CLOSE;
extern double step_psar=0.01;
extern double max_psar=0.3;
extern int period_boll=14;
extern int dev_boll=2;
extern int bolldiff=15;

//---- buffers
double ExtMapBuffer1[];
double ExtMapBuffer2[];
double ExtMapBuffer3[];
double ExtMapBuffer4[];

double drawMA,ma0,ma1;
double ca;
double psar;
double boll_upper0,boll_upper1;
double boll_lower0,boll_lower1;
double bollingerdiff0,bollingerdiff1;
int    barsToProcess=500;
//+------------------------------------------------------------------+
//| Custom indicator initialization function                         |
//+------------------------------------------------------------------+
int init()
  {
//---- indicators

   SetIndexStyle(0,DRAW_ARROW);
   SetIndexArrow(0,119);
   SetIndexBuffer(0,ExtMapBuffer4);
   SetIndexEmptyValue(0,EMPTY_VALUE);

   SetIndexStyle(1,DRAW_ARROW);
   SetIndexArrow(1,119);
   SetIndexBuffer(1,ExtMapBuffer1);
   SetIndexEmptyValue(1,EMPTY_VALUE);

   SetIndexStyle(2,DRAW_ARROW);
   SetIndexArrow(2,119);
   SetIndexBuffer(2,ExtMapBuffer2);
   SetIndexEmptyValue(2,EMPTY_VALUE);

   SetIndexStyle(3,DRAW_ARROW);
   SetIndexArrow(3,119);
   SetIndexBuffer(3,ExtMapBuffer3);
   SetIndexEmptyValue(3,EMPTY_VALUE);

//----
   return(0);
  }
//+------------------------------------------------------------------+
//| Custom indicator deinitialization function                       |
//+------------------------------------------------------------------+
int deinit()
  {
//----

//----
   return(0);
  }
//+------------------------------------------------------------------+
//| Custom indicator iteration function                              |
//+------------------------------------------------------------------+
int start()
  {
   int counted_bars=IndicatorCounted(), limit;
   int i=0;
   if (counted_bars>0)
       counted_bars--;

   limit=Bars-counted_bars;

   if(limit>barsToProcess)
      limit=barsToProcess;

   while (i<limit)
   {

   drawMA=iMA(NULL,0,7,0,MODE_SMA,(High[i]-Low[i])/2,i);


   ma0=iMA(NULL,0,period_ma,0,method_,price_,i);
   ma1=iMA(NULL,0,period_ma,0,method_,price_,i+1);
   psar=iSAR(NULL,0,step_psar,max_psar,i);
   boll_lower0=iBands(NULL,0,period_boll,dev_boll,0,PRICE_CLOSE,MODE_LOWER,i);
   boll_upper0=iBands(NULL,0,period_boll,dev_boll,0,PRICE_CLOSE,MODE_UPPER,i);
   bollingerdiff0=(boll_upper0-boll_lower0)/Point;
   boll_lower1=iBands(NULL,0,period_boll,dev_boll,0,PRICE_CLOSE,MODE_LOWER,i+1);
   boll_upper1=iBands(NULL,0,period_boll,dev_boll,0,PRICE_CLOSE,MODE_UPPER,i+1);
   bollingerdiff1=(boll_upper1-boll_lower1)/Point;


   //SELL SIGNAL
   if(ma0<=ma1 && psar>Close[i] && bollingerdiff0>bolldiff && bollingerdiff0>bollingerdiff1)
      ExtMapBuffer1[i]=drawMA;
      ExtMapBuffer4[i]=drawMA;


   //BUY SIGNAL
   if(ma0>=ma1 && psar<Close[i] && bollingerdiff0>bolldiff && bollingerdiff0>bollingerdiff1)
      ExtMapBuffer2[i]=drawMA;
      ExtMapBuffer4[i]=drawMA;


   if(ExtMapBuffer1[i]==EMPTY_VALUE && ExtMapBuffer2[i]==EMPTY_VALUE)
      ExtMapBuffer3[i]=drawMA;

   i++;
   }

//----
   return(0);
  }
//+------------------------------------------------------------------+
Comments