VTS_VG_TS_setka_v2
Download script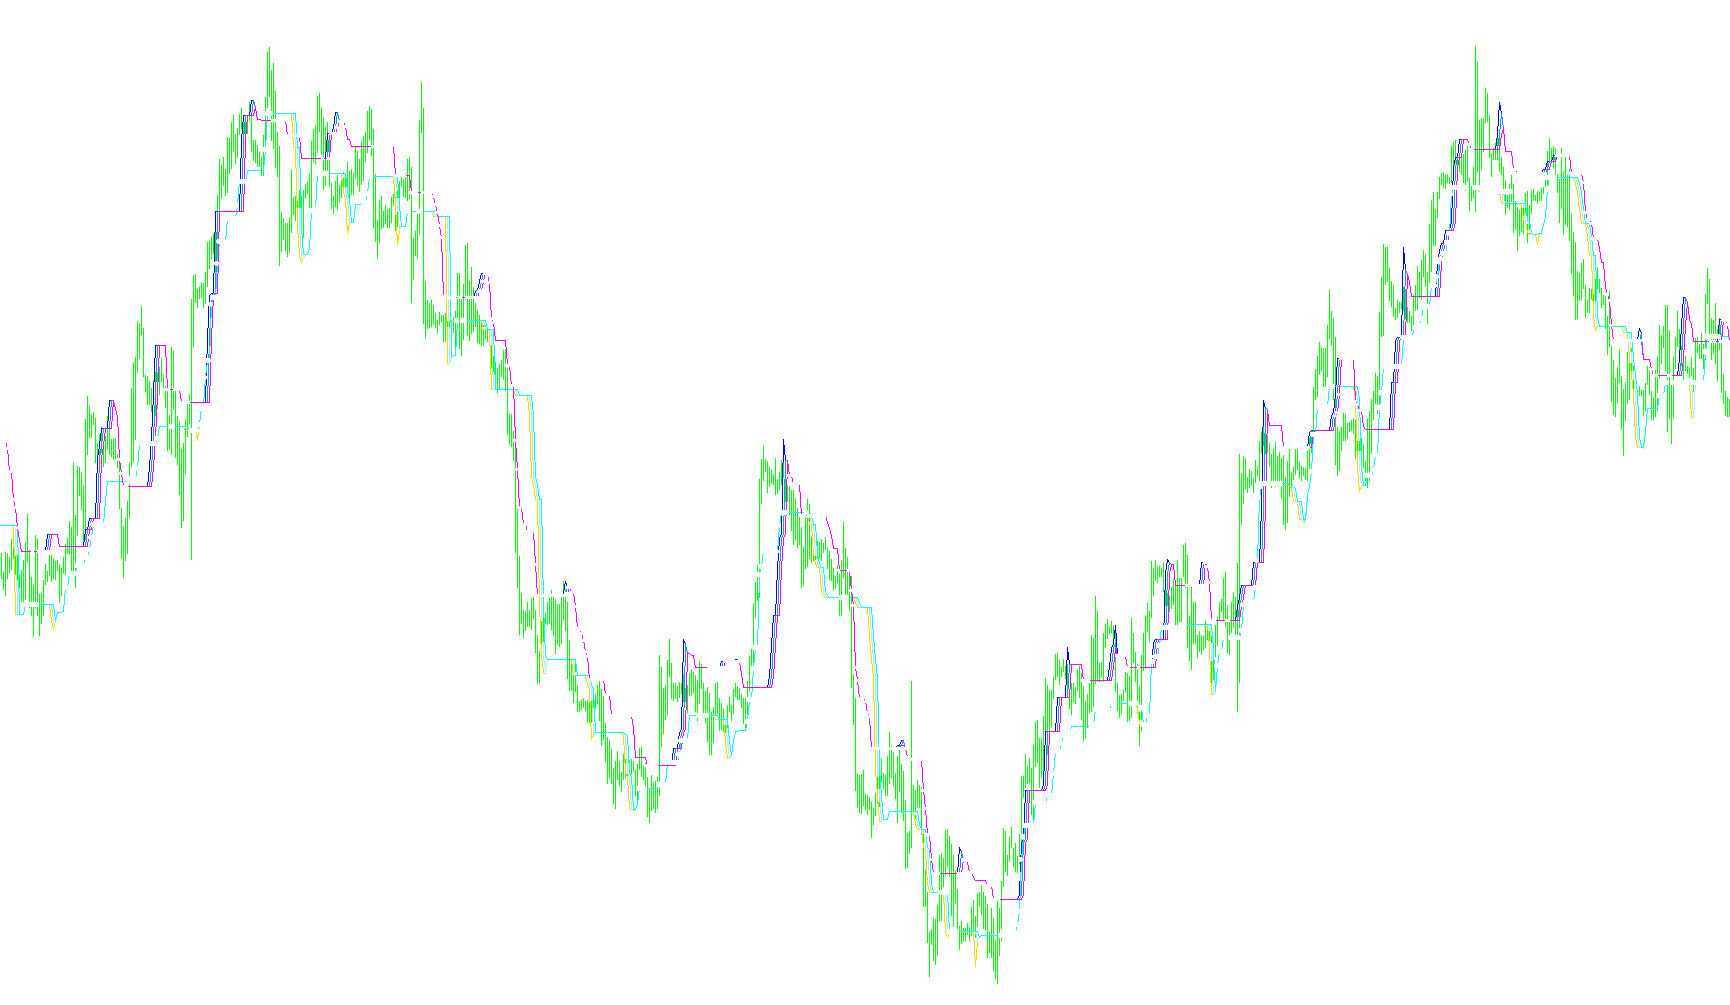
This script is a technical analysis tool designed to identify structural boundaries and potential trend shifts in financial markets. It functions by calculating dynamic price zones based on volatility and then layering multiple mathematical filters to "smooth" out market noise.
Core Logic and Functionality
1. Volatility-Based Boundaries The logic begins by measuring the market's current volatility using a standard ATR (Average True Range) calculation. It creates two primary boundaries:
- An Upper Boundary: Calculated by adding a multiple of the volatility to the current price.
- A Lower Boundary: Calculated by subtracting that same volatility multiple from the current price.
These boundaries essentially define a "normal" trading range based on how much the asset typically moves in a given timeframe.
2. Multi-Layered Filtering (The "Groups") The script features a unique hierarchical system called "Groups." As the user increases the Group number, the script applies successive layers of mathematical processing to the boundaries:
- Each new layer looks at the previous results and applies a High/Low comparison.
- Specifically, it identifies the maximum (highest point) of the upper boundary and the minimum (lowest point) of the lower boundary.
- By repeating this process multiple times (up to four distinct levels), the script filters out minor price fluctuations, leaving behind only the most significant structural price levels.
3. Trend Identification and Visual Cues In its most advanced setting (Group 4), the script performs a final comparison between the current market price and these deeply filtered boundaries:
- Trend Detection: It monitors whether the price is breaking above or below these smoothed structural lines.
- Visual Signals: When the price interacts with these levels in a specific way, the script generates visual indicators (arrows) on the chart. These serve as alerts for potential price reversals or significant trend changes.
Summary for the User
Think of this tool as a "noise filter" for price action. Instead of reacting to every small movement, it uses volatility to see how far the price can move, then stacks several layers of logic to find the strongest "walls" in the market. It ultimately seeks to highlight major structural points where the price might change direction, providing a clearer picture of the overall market trend.
//+------------------------------------------------------------------+
//|                                                          VTS.mq4 |
//|                                                             IZZY |
//|                                                                  |
//+------------------------------------------------------------------+
#property copyright "IZZY"
#property link      ""
//----
#define MAXBARSCOUNT 150000
//----
#property indicator_chart_window
#property indicator_buffers 8
#property indicator_color1 Aqua
#property indicator_color2 Magenta
#property indicator_color3 Aqua
#property indicator_color4 Magenta
#property indicator_color5 Aqua
#property indicator_color6 Magenta
#property indicator_color7 Blue
#property indicator_color8 Red
//+------------------------------------------------------------------+
//| Custom indicator initialization function                         |
//+------------------------------------------------------------------+
//extern int Sb = 300;
extern int    PeriodAtr=10;
extern double kATR     =2.0;
extern int    GrupNum  =4;
//----
double VTS[MAXBARSCOUNT];
double VTS1[MAXBARSCOUNT];
double VTS2[MAXBARSCOUNT];
double VTS3[MAXBARSCOUNT];
double VTS4[MAXBARSCOUNT];
double VTS5[MAXBARSCOUNT];
double VTS6[MAXBARSCOUNT];
double VTS7[MAXBARSCOUNT];
//
double VTS8[MAXBARSCOUNT];
double VTS9[MAXBARSCOUNT];
double VTS10[MAXBARSCOUNT];
double VTS11[MAXBARSCOUNT];
double VTS12[MAXBARSCOUNT];
double VTS13[MAXBARSCOUNT];
double VTS14[MAXBARSCOUNT];
double VTS15[MAXBARSCOUNT];
//
double VTS16[MAXBARSCOUNT];
double VTS17[MAXBARSCOUNT];
double VTS18[MAXBARSCOUNT];
double VTS19[MAXBARSCOUNT];
double VTS20[MAXBARSCOUNT];
double VTS21[MAXBARSCOUNT];
double VTS22[MAXBARSCOUNT];
double VTS23[MAXBARSCOUNT];
//
double VTS24[MAXBARSCOUNT];
double VTS25[MAXBARSCOUNT];
double VTS26[MAXBARSCOUNT];
double VTS27[MAXBARSCOUNT];
double VTS28[MAXBARSCOUNT];
double VTS29[MAXBARSCOUNT];
double VTS_TS[MAXBARSCOUNT];
double VTS_TS1[MAXBARSCOUNT];
//+------------------------------------------------------------------+
//|                                                                  |
//+------------------------------------------------------------------+
int init()
  {
//---- indicators
   IndicatorBuffers(8);
     if(GrupNum==1){
      SetIndexBuffer(0, VTS);
      SetIndexBuffer(1, VTS1);
      SetIndexBuffer(2, VTS2);
      SetIndexBuffer(3, VTS3);
      SetIndexBuffer(4, VTS4);
      SetIndexBuffer(5, VTS5);
      SetIndexBuffer(6, VTS6);
      SetIndexBuffer(7, VTS7);
     }
     if(GrupNum==2)
     {
      SetIndexBuffer(0, VTS8);
      SetIndexBuffer(1, VTS9);
      SetIndexBuffer(2, VTS10);
      SetIndexBuffer(3, VTS11);
      SetIndexBuffer(4, VTS12);
      SetIndexBuffer(5, VTS13);
      SetIndexBuffer(6, VTS14);
      SetIndexBuffer(7, VTS15);
     }
     if(GrupNum==3)
     {
      SetIndexBuffer(0, VTS16);
      SetIndexBuffer(1, VTS17);
      SetIndexBuffer(2, VTS18);
      SetIndexBuffer(3, VTS19);
      SetIndexBuffer(4, VTS20);
      SetIndexBuffer(5, VTS21);
      SetIndexBuffer(4, VTS22);
      SetIndexBuffer(5, VTS23);
     }
     if(GrupNum==4)
     {
      SetIndexBuffer(0, VTS24);
      SetIndexBuffer(1, VTS25);
      SetIndexBuffer(2, VTS26);
      SetIndexBuffer(3, VTS27);
      SetIndexBuffer(4, VTS28);
      SetIndexBuffer(5, VTS29);
      SetIndexBuffer(6, VTS_TS);
      SetIndexStyle(6,DRAW_ARROW);
      SetIndexArrow(6,159);
      SetIndexBuffer(7, VTS_TS1);
      SetIndexStyle(7,DRAW_ARROW);
      SetIndexArrow(7,159);
     }
//----
   return(0);
  }
//+------------------------------------------------------------------+
//| Custor indicator deinitialization function                       |
//+------------------------------------------------------------------+
int deinit()
  {
//----
//----
   return(0);
  }
//+------------------------------------------------------------------+
//| Custom indicator iteration function                              |
//+------------------------------------------------------------------+
int start()
  {
   int    counted_bars=IndicatorCounted();
//----
   int    StartBars=Bars - counted_bars+2;
   //if (StartBars<Sb) StartBars = Sb;
     for(int i=StartBars; i>=0; i--)
     {
      VTS[i]=(Close[i]-kATR*iATR(NULL,0,PeriodAtr,i));
      VTS1[i]= (Close[i]+kATR*iATR(NULL,0,PeriodAtr,i));
     }
     for(i=StartBars-1; i>0; i--)
     {
      VTS2[i]= MathMax(VTS[i],VTS[i+1]);
      VTS3[i]= MathMin(VTS1[i],VTS1[i+1]);
      VTS4[i]= MathMax(VTS2[i],VTS2[i+1]);//VTS2[i+1];
      VTS5[i]= MathMin(VTS3[i],VTS3[i+1]);//VTS3[i+1];
      VTS6[i]= MathMax(VTS4[i],VTS4[i+1]);//VTS4[i+1];
      VTS7[i]= MathMin(VTS5[i],VTS5[i+1]);//VTS5[i+1];
        if (GrupNum>=2)
        {
         VTS8[i]= MathMax(VTS6[i],VTS6[i+1]);//VTS6[i+1];
         VTS9[i]= MathMin(VTS7[i],VTS7[i+1]);//VTS7[i+1];
         VTS10[i]= MathMax(VTS8[i],VTS8[i+1]);//VTS8[i+1];
         VTS11[i]= MathMin(VTS9[i],VTS9[i+1]);//VTS9[i+1];
         VTS12[i]= MathMax(VTS10[i],VTS10[i+1]);//VTS10[i+1];
         VTS13[i]= MathMin(VTS11[i],VTS11[i+1]);//VTS11[i+1];
         VTS14[i]= MathMax(VTS12[i],VTS12[i+1]);//VTS10[i+1];
         VTS15[i]= MathMin(VTS13[i],VTS13[i+1]);//VTS11[i+1];
        }
        if (GrupNum>=3)
        {
         VTS16[i]= MathMax(VTS14[i],VTS14[i+1]);//VTS6[i+1];
         VTS17[i]= MathMin(VTS15[i],VTS15[i+1]);//VTS7[i+1];
         VTS18[i]= MathMax(VTS16[i],VTS16[i+1]);//VTS6[i+1];
         VTS19[i]= MathMin(VTS17[i],VTS17[i+1]);//VTS7[i+1];
         VTS20[i]= MathMax(VTS18[i],VTS18[i+1]);//VTS6[i+1];
         VTS21[i]= MathMin(VTS19[i],VTS19[i+1]);//VTS7[i+1];
         VTS22[i]= MathMax(VTS20[i],VTS20[i+1]);//VTS6[i+1];
         VTS23[i]= MathMin(VTS21[i],VTS21[i+1]);//VTS7[i+1];
        }
        if (GrupNum>=4)
        {
         VTS24[i]= MathMax(VTS22[i],VTS22[i+1]);//VTS6[i+1];
         VTS25[i]= MathMin(VTS23[i],VTS23[i+1]);//VTS7[i+1];
         VTS26[i]= MathMax(VTS24[i],VTS24[i+1]);//VTS6[i+1];
         VTS27[i]= MathMin(VTS25[i],VTS25[i+1]);//VTS7[i+1];
         VTS28[i]= MathMax(VTS26[i],VTS26[i+1]);//VTS6[i+1];
         VTS29[i]= MathMin(VTS27[i],VTS27[i+1]);//VTS7[i+1];
         VTS_TS[i] =VTS_TS[i+1];
         VTS_TS1[i]=VTS_TS1[i+1];
           if (Close[i]>VTS29[i])
           {
            VTS_TS[i]=VTS28[i];
            VTS_TS1[i]=0;//VTS_TS[i+1];
           }
           if (Close[i]<VTS28[i])
           {
            VTS_TS1[i]= VTS29[i];
            VTS_TS[i]=0;//VTS_TS1[i+1];
           }
        }
     }
//----
   return(0);
  }
//+------------------------------------------------------------------+
Comments