VROC
Download script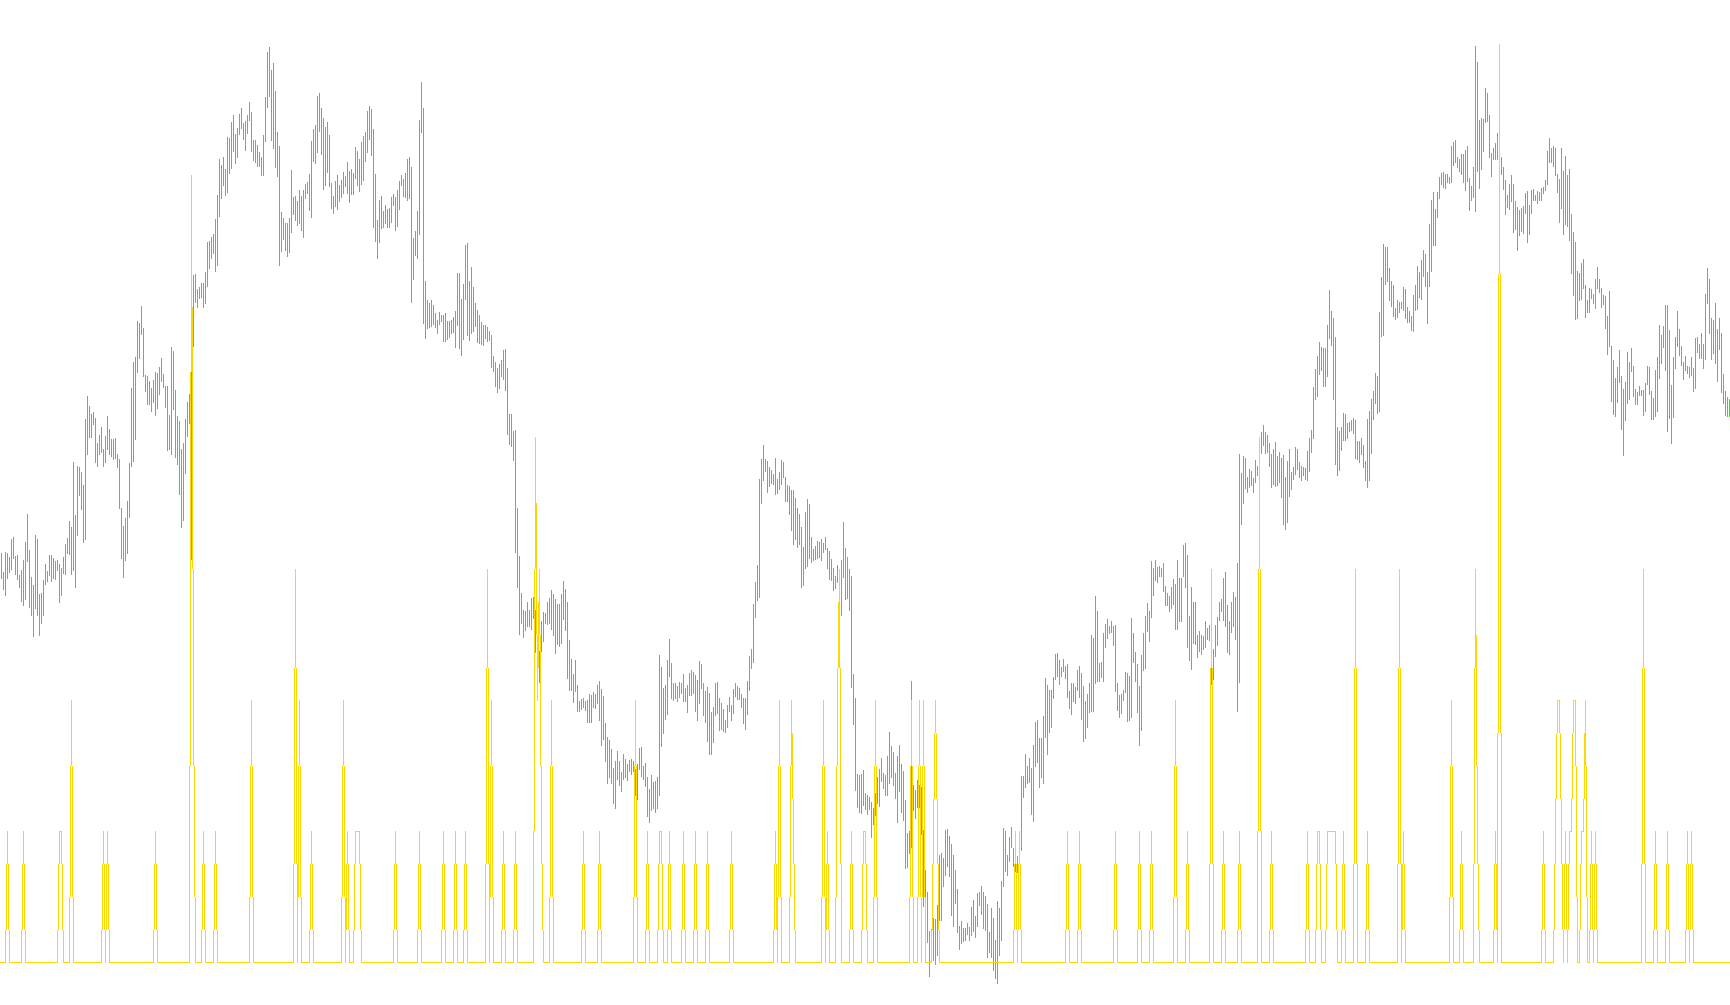
This tool is designed to help traders visualize changes in market activity over a specific period of time. Instead of looking at the price of an asset, this indicator focuses on trading volume, which represents the amount of buying and selling activity happening in the market.
How it Works
The core logic of this script centers on calculating the percentage change in volume compared to a past point in time. Here is the step-by-step breakdown of how it processes information:
- Time Window Selection: The user can define a specific "period" (for example, 25 bars). This determines how far back into the past the tool looks to make its comparison.
- Volume Comparison: For every point on the chart, the tool takes the current trading volume and compares it to the volume from exactly one period ago.
- Percentage Calculation: It subtracts the old volume from the current volume, divides it by the old volume, and converts it into a percentage.
- Visual Output: The result is plotted as a line on a separate window below your main price chart.
What This Means for the Trader
By converting raw volume data into a percentage change, the tool highlights the momentum of activity.
- Rising Line: If the line moves upward, it indicates that trading activity is increasing more rapidly than it was during the previous period. This suggests growing interest or intensity in the market.
- Falling Line: If the line moves downward, it means trading volume is decreasing relative to the past period, which could signify a cooling off in market participation.
In simple terms, this tool filters out the "noise" of raw numbers and provides a clear visual trend of whether the market's participation levels are expanding or contracting over time.
Miscellaneous
11
Views
0
Downloads
0
Favorites
VROC
//+------------------------------------------------------------------+
//|                                                         VROC.mq4 |
//|                      Copyright © 2007, MetaQuotes Software Corp. |
//|                                        http://www.metaquotes.ru/ |
//+------------------------------------------------------------------+
#property copyright "Copyright © 2007, MetaQuotes Software Corp."
#property link      "http://www.metaquotes.ru/"
//----
#property indicator_separate_window
#property indicator_buffers 1
#property indicator_color1 Green
//---- input parameters
extern int PeriodROC = 25;
//---- buffers
double ExtMapBuffer1[];
//+------------------------------------------------------------------+
//| Custom indicator initialization function                         |
//+------------------------------------------------------------------+
int init()
  {
//---- indicators
   SetIndexStyle(0, DRAW_LINE);
   SetIndexBuffer(0, ExtMapBuffer1);
   IndicatorShortName("VROC(" + PeriodROC + ")");
   IndicatorDigits(2);
//----
   return(0);
  }
//+------------------------------------------------------------------+
//| Custom indicator deinitialization function                       |
//+------------------------------------------------------------------+
int deinit()
  {
//----
   return(0);
  }
//+------------------------------------------------------------------+
//| Custom indicator iteration function                              |
//+------------------------------------------------------------------+
int start()
  {
   int counted_bars = IndicatorCounted();
   int i, limit;
//----
   if(counted_bars == 0)
       limit = Bars - PeriodROC;
   if(counted_bars > 0)
       limit = Bars - counted_bars;
   limit--;
   for(i = limit; i >= 0; i--)
       ExtMapBuffer1[i] = (Volume[i] - Volume[i + PeriodROC]) /
                          Volume[i+PeriodROC]*100;
//----
   return(0);
  }
//+------------------------------------------------------------------+
Comments