Traders_Dynamic_Index
Download script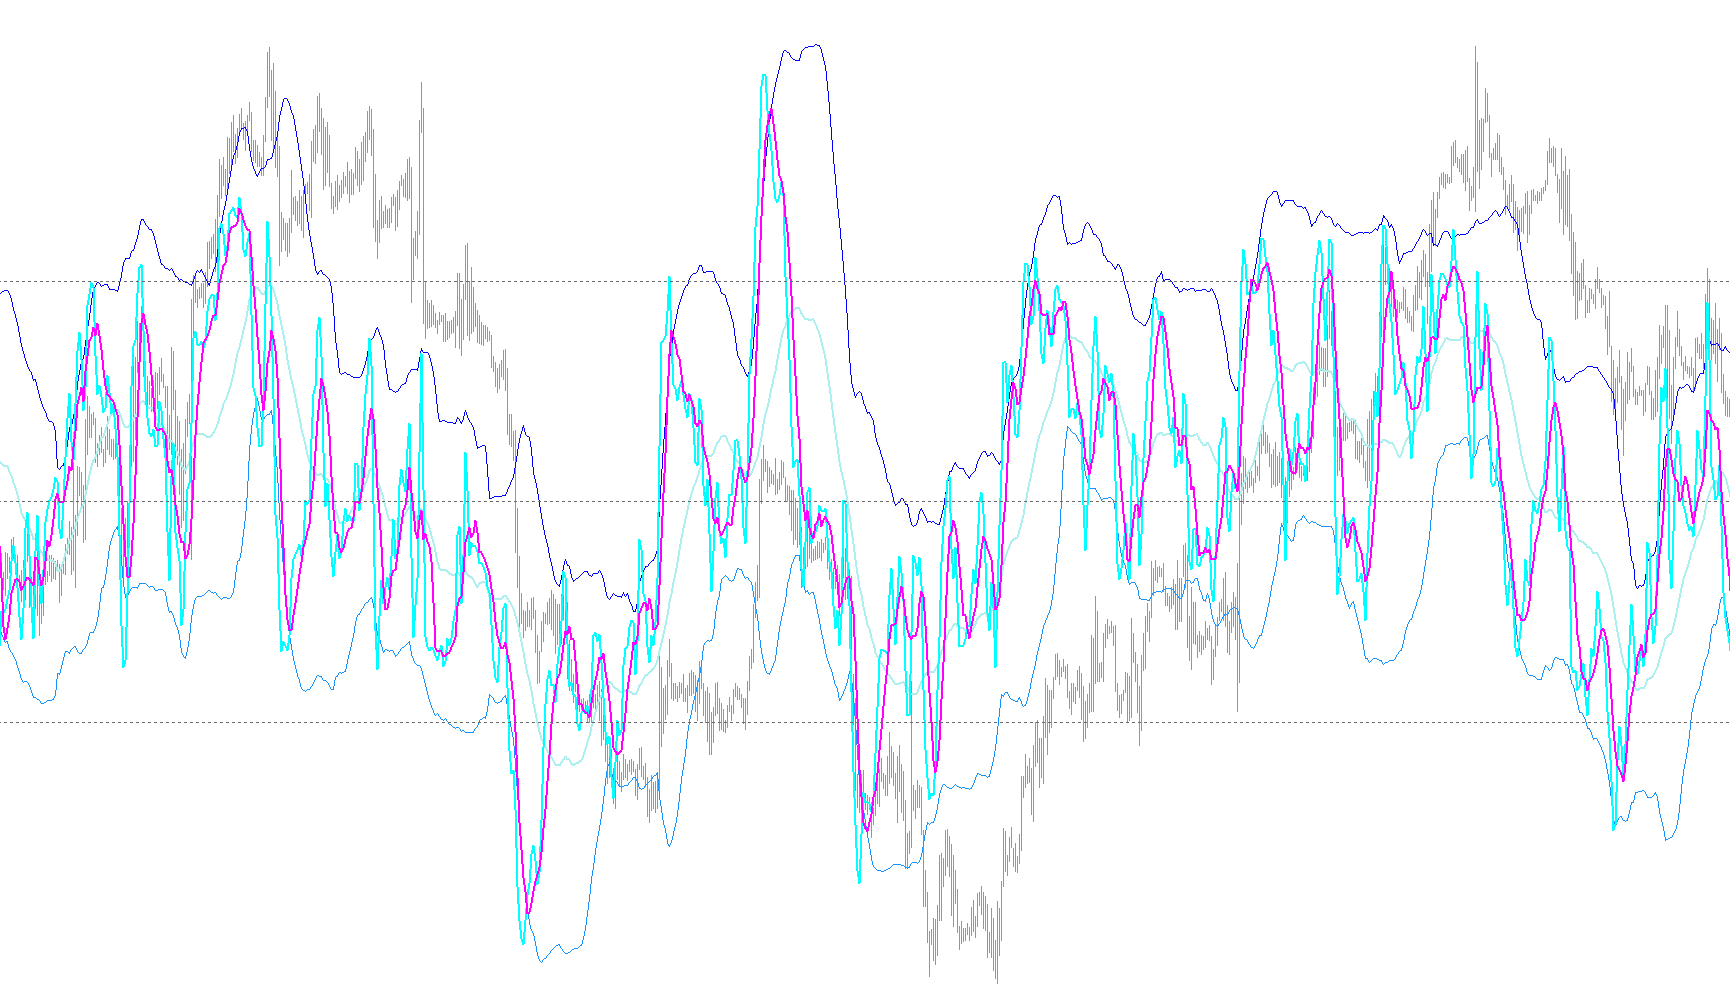
The Traders Dynamic Index (T.D.I.) is a sophisticated, hybrid market analysis tool designed to provide traders with a comprehensive view of the market's "health." Rather than relying on a single metric, it combines three core elements—trend direction, market strength, and volatility—into one visual interface to help users make more informed trading decisions.
How the Visuals Work
The indicator utilizes several distinct lines and bands to communicate different layers of information:
- Green Line (Price Action): Represents the immediate momentum of the price.
- Red Line (Trade Signal): Acts as a moving average for the price action, helping to smooth out "noise" and identify the underlying trend.
- Blue Lines (Volatility Band): These lines wrap around the center to show how much the market is fluctuating.
- Yellow Line (Market Base Line): This serves as the "equilibrium" or anchor point for the overall trend.
Core Logic & Interpretation
1. Trend Direction
The tool allows you to identify trends at two different speeds:
- Immediate Trend: By looking at the relationship between the Green and Red lines, you can see the current price movement. If the Green line is above the Red, the immediate momentum is upward; if it is below, it is downward.
- Overall Trend: The Yellow line tracks the long-term direction. Generally, when this line moves between the 32 and 68 marks, it indicates a sustained trend. Traders often look for "bounces" off these levels to spot potential reversals.
2. Market Strength & Volatility
The indicator helps distinguish between a "strong" move and a "lazy" market:
- Strength: A steep slope on the Green line suggests high-intensity movement, while a flat or moderate slope indicates weakness or consolidation.
- Volatility: This is visualized by the distance between the Blue lines.
- Expanding Bands: Indicate a strong, trending market with high activity.
- Constricting Bands: Suggest a weak market moving sideways within a range.
- Tight Bands: When these lines become extremely narrow, it often signals a period of compression, which may precede a sharp spike or major breakout caused by economic news.
Practical Trading Application
The script provides a framework for different trading styles based on how many conditions the user wants to satisfy before entering a trade:
- Scalping (Quick Trades): Focuses purely on the immediate crossover of the Green and Red lines.
- Active Trading: Requires both the Green/Red crossover and the position relative to the Yellow Market Base Line.
- Moderate Trading: The most conservative approach, requiring the Green line to be above the Red line, the Yellow line, and a specific 50-level midpoint.
Exit Strategy
The logic also provides clear signals for when to take profits or cut losses:
- Primary Exit: When the Green line crosses back over the Red line in the opposite direction of the trade.
- Volatility Exit: If the Green line breaks through one of the Blue Volatility Bands, traders may choose to exit when the price returns to the other side of that band, signaling a loss of momentum.
//+------------------------------------------------------------------+
//|                                    Traders Dynamic Index.mq4     |
//|                                    Copyright © 2006, Dean Malone |
//|                                    www.compassfx.com             |
//+------------------------------------------------------------------+

//+------------------------------------------------------------------+
//|                                                                  |
//|                     Traders Dynamic Index                        |
//|                                                                  |
//|  This hybrid indicator is developed to assist traders in their   |
//|  ability to decipher and monitor market conditions related to    |
//|  trend direction, market strength, and market volatility.        |
//|                                                                  |
//|  Even though comprehensive, the T.D.I. is easy to read and use.  |
//|                                                                  |
//|  Green line = RSI Price line                                     |
//|  Red line = Trade Signal line                                    |
//|  Blue lines = Volatility Band                                    |
//|  Yellow line = Market Base Line                                  |
//|                                                                  |
//|  Trend Direction - Immediate and Overall                         |
//|   Immediate = Green over Red...price action is moving up.        |
//|               Red over Green...price action is moving down.      |
//|                                                                  |
//|   Overall = Yellow line trends up and down generally between the |
//|             lines 32 & 68. Watch for Yellow line to bounces off  |
//|             these lines for market reversal. Trade long when     |
//|             price is above the Yellow line, and trade short when |
//|             price is below.                                      |
//|                                                                  |
//|  Market Strength & Volatility - Immediate and Overall            |
//|   Immediate = Green Line - Strong = Steep slope up or down.      |
//|                            Weak = Moderate to Flat slope.        |
//|                                                                  |
//|   Overall = Blue Lines - When expanding, market is strong and    |
//|             trending. When constricting, market is weak and      |
//|             in a range. When the Blue lines are extremely tight  |
//|             in a narrow range, expect an economic announcement   |
//|             or other market condition to spike the market.       |
//|                                                                  |
//|                                                                  |
//|  Entry conditions                                                |
//|   Scalping  - Long = Green over Red, Short = Red over Green      |
//|   Active - Long = Green over Red & Yellow lines                  |
//|            Short = Red over Green & Yellow lines                 |
//|   Moderate - Long = Green over Red, Yellow, & 50 lines           |
//|              Short= Red over Green, Green below Yellow & 50 line |
//|                                                                  |
//|  Exit conditions*                                                |
//|   Long = Green crosses below Red                                 |
//|   Short = Green crosses above Red                                |
//|   * If Green crosses either Blue lines, consider exiting when    |
//|     when the Green line crosses back over the Blue line.         |
//|                                                                  |
//|                                                                  |
//|  IMPORTANT: The default settings are well tested and proven.     |
//|             But, you can change the settings to fit your         |
//|             trading style.                                       |
//|                                                                  |
//|                                                                  |
//|  Price & Line Type settings:                           |
//|   RSI Price settings                                             |
//|   0 = Close price     [DEFAULT]                                  |
//|   1 = Open price.                                                |
//|   2 = High price.                                                |
//|   3 = Low price.                                                 |
//|   4 = Median price, (high+low)/2.                                |
//|   5 = Typical price, (high+low+close)/3.                         |
//|   6 = Weighted close price, (high+low+close+close)/4.            |
//|                                                                  |
//|   RSI Price Line & Signal Line Type settings                                   |
//|   0 = Simple moving average       [DEFAULT]                      |
//|   1 = Exponential moving average                                 |
//|   2 = Smoothed moving average                                    |
//|   3 = Linear weighted moving average                             |
//|                                                                  |
//|   Good trading,                                                  |
//|                                                                  |
//|   Dean                                                           |
//+------------------------------------------------------------------+


#property indicator_buffers 6
#property indicator_color1 Black
#property indicator_color2 MediumBlue
#property indicator_color3 Yellow
#property indicator_color4 MediumBlue
#property indicator_color5 Green
#property indicator_color6 Red
#property indicator_separate_window

extern int RSI_Period = 13;         //8-25
extern int RSI_Price = 0;           //0-6
extern int Volatility_Band = 34;    //20-40
extern int RSI_Price_Line = 2;
extern int RSI_Price_Type = 0;      //0-3
extern int Trade_Signal_Line = 7;
extern int Trade_Signal_Type = 0;   //0-3

double RSIBuf[],UpZone[],MdZone[],DnZone[],MaBuf[],MbBuf[];

int init()
  {
   IndicatorShortName("Traders Dynamic Index");
   SetIndexBuffer(0,RSIBuf);
   SetIndexBuffer(1,UpZone);
   SetIndexBuffer(2,MdZone);
   SetIndexBuffer(3,DnZone);
   SetIndexBuffer(4,MaBuf);
   SetIndexBuffer(5,MbBuf);

   SetIndexStyle(0,DRAW_NONE);
   SetIndexStyle(1,DRAW_LINE);
   SetIndexStyle(2,DRAW_LINE,0,2);
   SetIndexStyle(3,DRAW_LINE);
   SetIndexStyle(4,DRAW_LINE,0,2);
   SetIndexStyle(5,DRAW_LINE,0,2);

   SetIndexLabel(0,NULL);
   SetIndexLabel(1,"VB High");
   SetIndexLabel(2,"Market Base Line");
   SetIndexLabel(3,"VB Low");
   SetIndexLabel(4,"RSI Price Line");
   SetIndexLabel(5,"Trade Signal Line");

   SetLevelValue(0,50);
   SetLevelValue(1,68);
   SetLevelValue(2,32);
   SetLevelStyle(STYLE_DOT,1,DimGray);

   return(0);
  }

int start()
  {
   double MA,RSI[];
   ArrayResize(RSI,Volatility_Band);
   int counted_bars=IndicatorCounted();
   int limit = Bars-counted_bars-1;
   for(int i=limit; i>=0; i--)
   {
      RSIBuf[i] = (iRSI(NULL,0,RSI_Period,RSI_Price,i));
      MA = 0;
      for(int x=i; x<i+Volatility_Band; x++) {
         RSI[x-i] = RSIBuf[x];
         MA += RSIBuf[x]/Volatility_Band;
      }
      UpZone[i] = (MA + (1.6185 * StDev(RSI,Volatility_Band)));
      DnZone[i] = (MA - (1.6185 * StDev(RSI,Volatility_Band)));
      MdZone[i] = ((UpZone[i] + DnZone[i])/2);
      }
   for (i=limit-1;i>=0;i--)
      {
       MaBuf[i] = (iMAOnArray(RSIBuf,0,RSI_Price_Line,0,RSI_Price_Type,i));
       MbBuf[i] = (iMAOnArray(RSIBuf,0,Trade_Signal_Line,0,Trade_Signal_Type,i));
      }
//----
   return(0);
  }

double StDev(double& Data[], int Per)
{return(MathSqrt(Variance(Data,Per)));
}
double Variance(double& Data[], int Per)
{double sum, ssum;
  for (int i=0; i<Per; i++)
  {sum += Data[i];
   ssum += MathPow(Data[i],2);
  }
  return((ssum*Per - sum*sum)/(Per*(Per-1)));
}
//+------------------------------------------------------------------+
Comments