TraderWawasan Indi Rantai~
Download script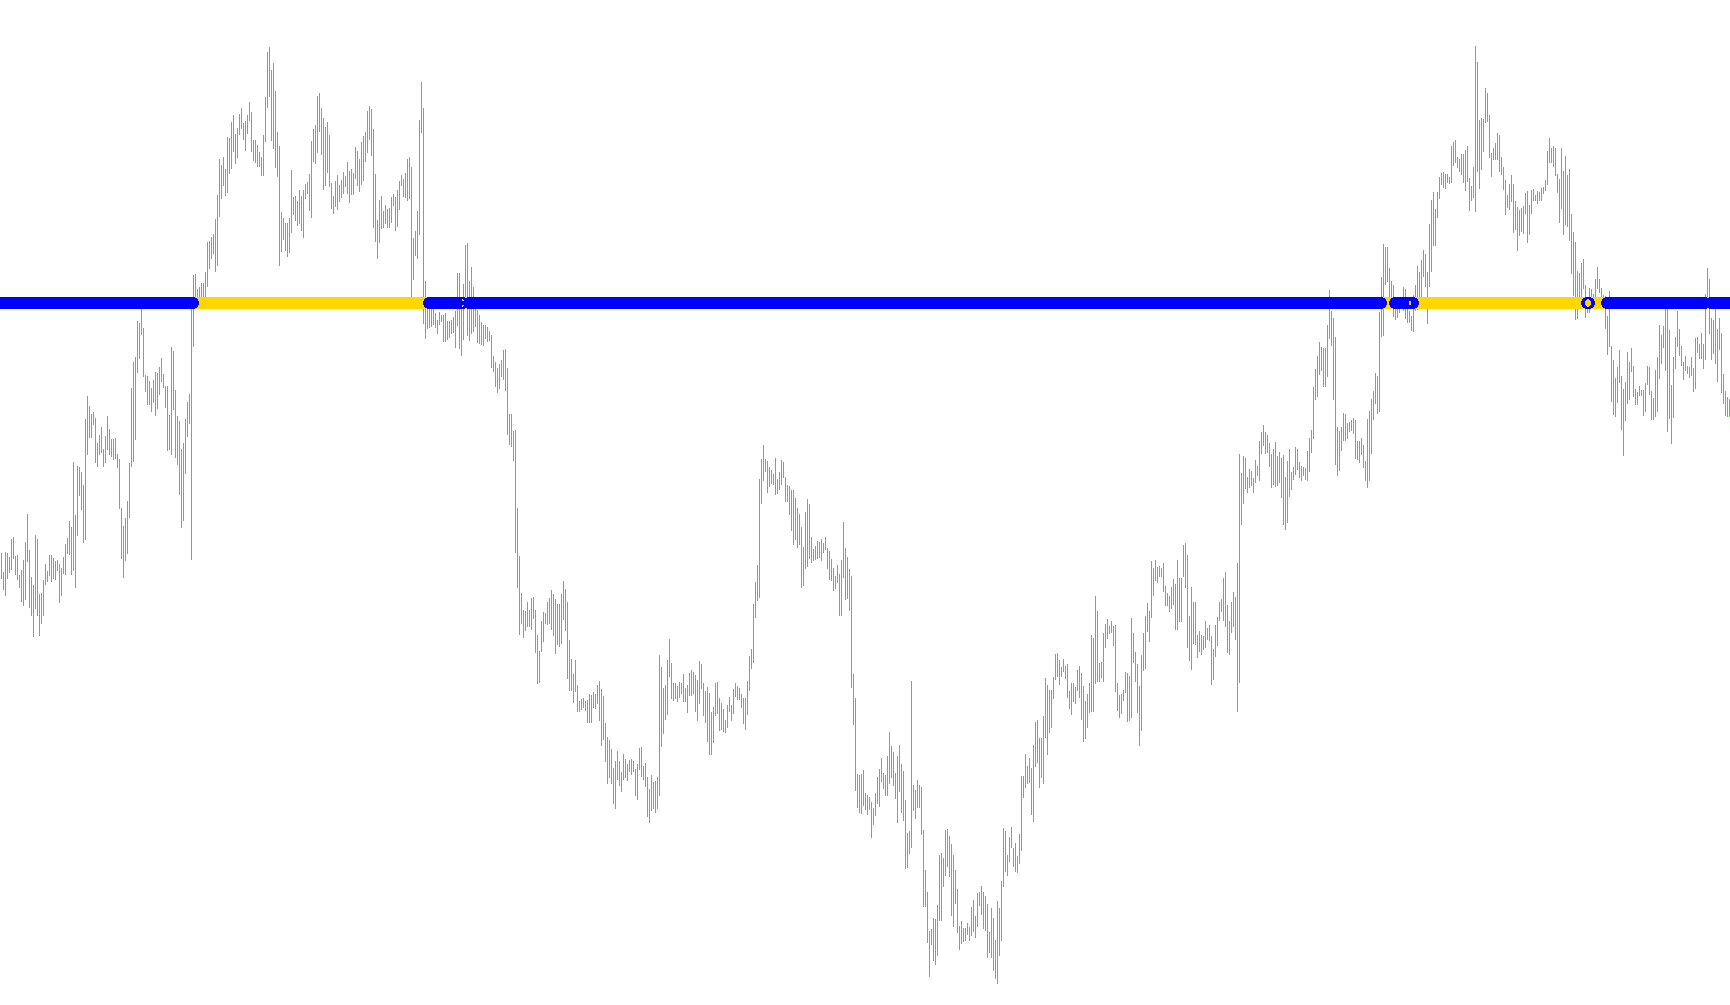
This technical indicator is designed to analyze market price movements by identifying significant structural turning points and potential trend reversals. Rather than reacting to every small price fluctuation, the tool filters out "market noise" to highlight key levels where the momentum of the asset may be shifting.
Core Functionality
The script operates by scanning historical price data to identify specific peaks and valleys. It utilizes a logic similar to a "ZigZag" structure, which focuses on significant price swings that exceed a certain magnitude (defined by the "depth" setting). By identifying these major structural points, the indicator helps traders visualize the primary "skeleton" of the market trend.
How it Works
- Timeframe Validation: Upon loading, the script checks your current chart settings. It ensures that the timeframe you are viewing is appropriate for its calculation logic; if the timeframe is too large, it will notify the user to ensure the data remains accurate.
- Structural Analysis: The script searches back through historical candles to locate significant price extremes. It specifically looks for instances where the market has moved enough to be considered a meaningful change in direction rather than a temporary spike.
- Trend Direction Identification: Once a significant turning point (a peak or a valley) is identified, the script compares the current closing price against that level:
- If the price closes below a confirmed high point, the logic identifies a potential downward shift.
- If the price closes above a confirmed low point, it identifies a potential upward shift.
- Visual Feedback: The results are displayed directly on your trading chart using distinct visual markers (arrows). These markers serve as signals to highlight where the market has reached a structural limit and may be preparing to change direction.
Summary for the Trader
This tool is intended to assist in identifying "Support" and "Resistance" zones dynamically. By highlighting these structural turning points, it allows you to see where the price has historically struggled to push further, providing a clearer picture of the market's overall flow and helping you spot potential entry or exit opportunities based on trend reversals.
/*
   Generated by EX4-TO-MQ4 decompiler ONE FILE V4.0.218.3
   EX4 ID : 04E20A41724C2645BAEB3FDF008C44EC
   Website: http://purebeam.biz
   E-mail : purebeam@gmail.com
*/
#property copyright "Copyright © 2005, klot"
#property link      " xxxxxx "

#property indicator_chart_window
#property indicator_buffers 2
#property indicator_color1 SpringGreen
#property indicator_color2 Yellow

extern int depth = 5;
extern int GrossPeriod = 30;
double g_ibuf_84[];
double g_ibuf_88[];
int gia_92[];

int init() {
   SetIndexStyle(0, DRAW_ARROW);
   SetIndexArrow(0, 162);
   SetIndexBuffer(0, g_ibuf_84);
   SetIndexEmptyValue(0, 0.0);
   SetIndexStyle(1, DRAW_ARROW);
   SetIndexArrow(1, 162);
   SetIndexBuffer(1, g_ibuf_88);
   SetIndexEmptyValue(1, 0.0);
   if (Period() > GrossPeriod) {
      Alert("Indicator Rantai Ubah Arah ", GrossPeriod);
      return (0);
   }
   ArrayCopySeries(gia_92, 5, Symbol(), GrossPeriod);
   return (0);
}

int deinit() {
   return (0);
}

int start() {
   int l_count_8;
   double l_icustom_12;
   int li_0 = IndicatorCounted();
   int li_4 = 300;
   if (li_0 < 0) return (-1);
   if (li_0 > 0) li_0--;
   li_4 = Bars - li_0;
   for (int l_index_20 = 0; l_index_20 < li_4; l_index_20++) {
      if (Time[l_index_20] >= gia_92[0]) l_count_8 = 0;
      else {
         l_count_8 = ArrayBsearch(gia_92, Time[l_index_20 - 1], WHOLE_ARRAY, 0, MODE_DESCEND);
         if (Period() <= GrossPeriod) l_count_8++;
      }
      for (int li_24 = l_count_8; li_24 < l_count_8 + 100; li_24++) {
         l_icustom_12 = iCustom(NULL, GrossPeriod, "ZigZag", depth, 2, 2, 0, li_24 + 1);
         if (l_icustom_12 != 0.0) break;
      }
      if (iClose(NULL, 0, l_index_20 + 1) <= l_icustom_12) g_ibuf_88[l_index_20] = l_icustom_12;
      else g_ibuf_88[l_index_20] = 0.0;
      if (iClose(NULL, 0, l_index_20 + 1) >= l_icustom_12) g_ibuf_84[l_index_20] = l_icustom_12;
      else g_ibuf_84[l_index_20] = 0.0;
      ObjectsRedraw();
   }
   return (0);
}
Comments