TradeSig_v2
Download script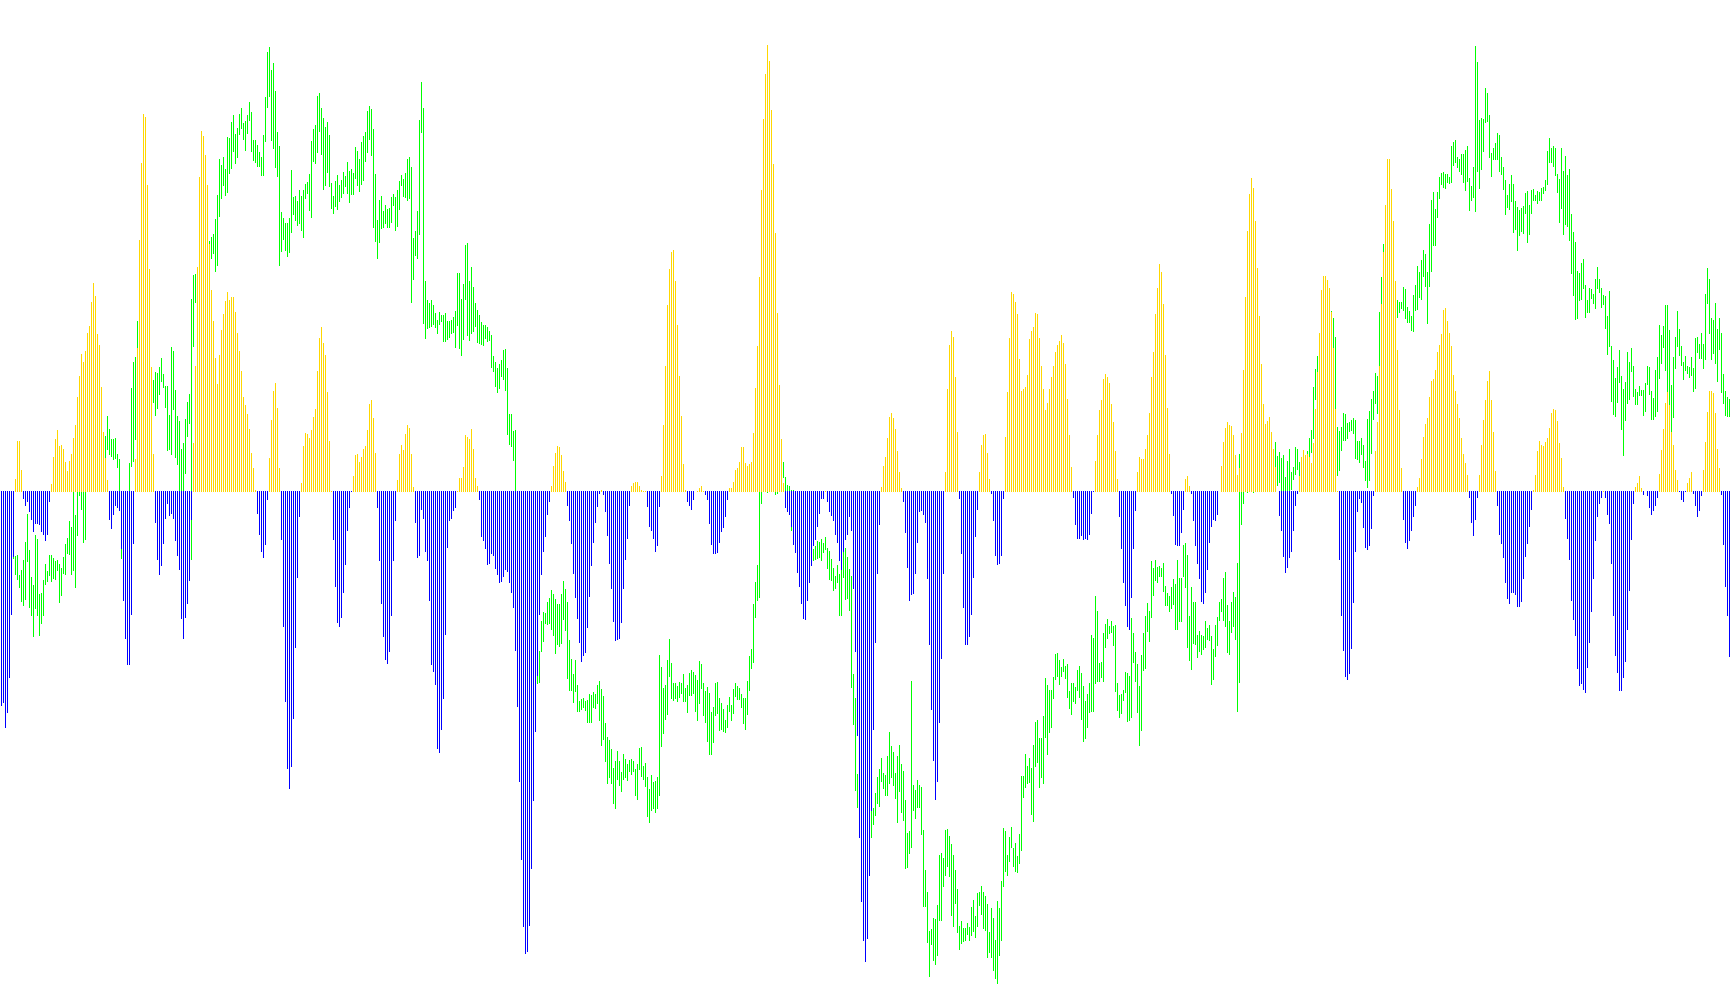
This tool is designed to help traders visualize market momentum and price trends by tracking the movement of a specific moving average over a set period. Instead of simply showing you where the price is, it focuses on how much that price trend is shifting or accelerating.
How it Works
The script operates by comparing two different points in time based on a user-defined period (which defaults to 8 units). It looks at the current "typical" price—a calculation based on the high, low, and closing prices of a candle—and compares it against the price from five steps back.
By calculating the difference between these two points, the tool generates a specific numerical value that represents the velocity of the trend.
Visual Representation
The logic translates these calculations into a dual-colored histogram displayed in a separate window below your main price chart:
- Upward Movement (Lime): When the current moving average is higher than the previous point, the tool recognizes positive momentum and displays a lime-colored bar. The height of this bar indicates how strongly the trend is moving upward.
- Downward Movement (Red): When the current moving average falls below the previous point, the tool identifies negative momentum and displays a red bar. The height of this bar shows the strength of the downward shift.
- Neutrality: If there is no significant change between the two points, the indicator remains flat, indicating a period of consolidation or sideways movement.
Summary for Traders
In simple terms, this script acts as a momentum gauge. Rather than cluttering your main chart with lines, it provides a clean visual representation of whether the market is pushing higher or lower, and how aggressively it is doing so at any given moment. It allows you to quickly identify shifts in trend strength by watching the expansion or contraction of the colored bars.
//+------------------------------------------------------------------+
//|                                                        SmCCI.mq4 |
//|                      Copyright © 2006, MetaQuotes Software Corp. |
//|                                        http://www.metaquotes.net |
//+------------------------------------------------------------------+
#property copyright "Copyright © 2006, MetaQuotes Software Corp."
#property link      "http://www.metaquotes.net"

#property indicator_separate_window
#property indicator_buffers 2
#property indicator_color1 Red
#property indicator_color2 Lime
//---- input parameters

extern int per=8;


//---- buffers
double ExtMapBuffer1[];
double ExtMapBuffer2[];


//+------------------------------------------------------------------+
//| Custom indicator initialization function                         |
//+------------------------------------------------------------------+
int init()
  {
//---- indicators
   SetIndexStyle(0,DRAW_HISTOGRAM);
   SetIndexBuffer(0,ExtMapBuffer1);
   SetIndexStyle(1,DRAW_HISTOGRAM);
   SetIndexBuffer(1,ExtMapBuffer2);
//----
   return(0);
  }
//+------------------------------------------------------------------+
//| Custom indicator iteration function                              |
//+------------------------------------------------------------------+
int start()
  {
   double malim, mared, delma;
   int limit;
   int counted_bars=IndicatorCounted();
   if(counted_bars<0) return(-1);
   if(counted_bars>0) counted_bars--;
   limit=Bars-counted_bars;
   for(int i=0; i<limit; i++)
   {
      malim=iMA(NULL,0,per,0,MODE_SMA,PRICE_TYPICAL,i);
      mared=iMA(NULL,0,per,0,MODE_SMA,PRICE_TYPICAL,i+5);
      delma=MathRound((malim-mared)/Point);
      ExtMapBuffer1[i]=0;
      ExtMapBuffer2[i]=0;
      if (delma>0) ExtMapBuffer1[i]=delma;
      if (delma<0) ExtMapBuffer2[i]=delma;
   }

   return(0);
  }
//+------------------------------------------------------------------+
Comments