Traders Dynamic Index VISUAL ALERTS
Download script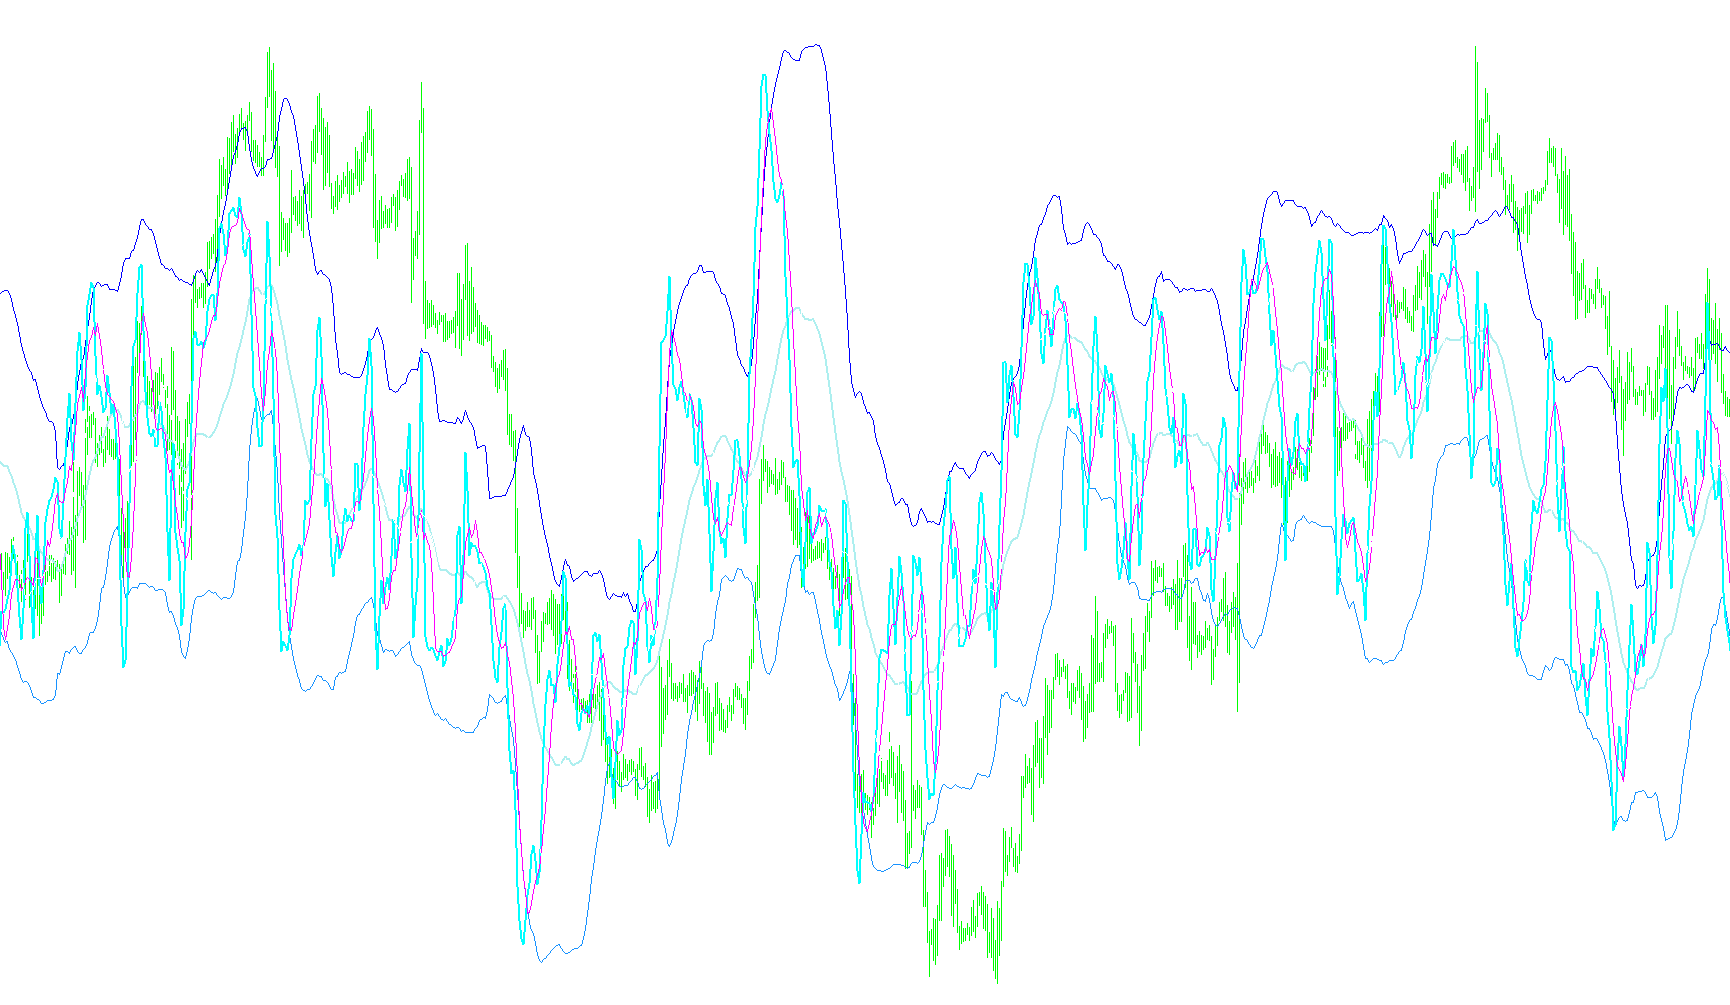
This script provides a comprehensive visual tool designed to help traders interpret complex market data—specifically trend direction, market strength, and volatility—through a simplified interface. Rather than forcing you to interpret raw numbers, it translates market behavior into distinct lines and visual cues.
Core Components and Visual Cues
The indicator populates your chart with several key elements:
- Price & Signal Lines: These are the primary drivers for identifying momentum. By comparing the position of the Green line against the Red line, you can instantly see if price action is moving upward (Green above Red) or downward (Red above Green).
- Volatility Bands (Blue Lines): These represent the "breathing" of the market. When these lines expand, it indicates a strong, trending market. When they contract or become extremely tight, it suggests a period of low activity or a potential upcoming price spike from an economic event.
- Market Base Line (Yellow Line): This acts as your primary navigation point for trend identification. It generally moves between the 32 and 68 levels.
Trend and Strength Analysis
The logic categorizes market conditions into "Immediate" and "Overall" states to help you filter out noise:
- Directional Logic: The script looks at whether price is above or below the Yellow Market Base Line. Generally, trading in the direction of this line (Long when above, Short when below) aligns with the broader trend.
- Momentum Strength: The steepness of the Green line's slope indicates immediate strength (steep slopes are strong; flat slopes are weak), while the expansion of the Blue Volatility Bands confirms overall market health.
Automated Trade Signals
The script features a built-in logic engine that translates these various data points into specific trading categories, displayed as text alerts on your screen:
- Scalping: Basic identification based on whether the Green line is above or below the Red line.
- Active & Moderate Trading: These require more confirmation, looking for the Price Line to be in specific relation to the Yellow Base Line and additional technical levels (like the 50-level midpoint).
- Strength Classifications: The script provides descriptive feedback such as "Strong Buy," "Weak Sell," or "Medium Buy" based on how far the price lines have moved relative to the Market Base Line.
- Cautionary Alerts: The system monitors for "reversals." If the price pushes too far into extreme zones (above 68 or below 32), it triggers a caution warning, indicating that the market may be overextended and due for a pullback.
Dynamic Visual Updates
To ensure you are always looking at current data, the script continuously refreshes:
- Dynamic Labeling: It places text labels on the chart to identify key price levels (68, 52, and 34), helping you keep track of your target zones.
- Consolidation Tracking: It monitors the distance between the Volatility Bands; if they remain narrow, it notifies you of a "Consolidation" period, signaling that the market is currently in a range-bound state rather than a trend.
Indicators Used
Miscellaneous
15
Views
0
Downloads
0
Favorites
Traders Dynamic Index VISUAL ALERTS
//+------------------------------------------------------------------+
//|                                    Traders Dynamic Index.mq4     |
//|                                    Copyright © 2006, Dean Malone |
//|                                    www.compassfx.com             |
//+------------------------------------------------------------------+
//+------------------------------------------------------------------+
//|                                                                  |
//|                     Traders Dynamic Index                        |
//|                                                                  |
//|  This hybrid indicator is developed to assist traders in their   |
//|  ability to decipher and monitor market conditions related to    |
//|  trend direction, market strength, and market volatility.        |
//|                                                                  |
//|  Even though comprehensive, the T.D.I. is easy to read and use.  |
//|                                                                  |
//|  Green line  = RSI Price line                                    |
//|  Red line    = Trade Signal line                                 |
//|  Blue lines  = Volatility Band                                   |
//|  Yellow line = Market Base Line                                  |
//|                                                                  |
//|  Trend Direction - Immediate and Overall                         |
//|   Immediate = Green over Red...price action is moving up.        |
//|               Red over Green...price action is moving down.      |
//|                                                                  |
//|   Overall = Yellow line trends up and down generally between the |
//|             lines 32 & 68. Watch for Yellow line to bounces off  |
//|             these lines for market reversal. Trade long when     |
//|             price is above the Yellow line, and trade short when |
//|             price is below.                                      |
//|                                                                  |
//|  Market Strength & Volatility - Immediate and Overall            |
//|   Immediate = Green Line - Strong = Steep slope up or down.      |
//|                            Weak = Moderate to Flat slope.        |
//|                                                                  |
//|   Overall = Blue Lines - When expanding, market is strong and    |
//|             trending. When constricting, market is weak and      |
//|             in a range. When the Blue lines are extremely tight  |
//|             in a narrow range, expect an economic announcement   |
//|             or other market condition to spike the market.       |
//|                                                                  |
//|                                                                  |
//|  Entry conditions                                                |
//|   Scalping  - Long = Green over Red, Short = Red over Green      |
//|   Active    - Long = Green over Red & Yellow lines               |
//|               Short = Red over Green & Yellow lines              |
//|   Moderate -  Long = Green over Red, Yellow, & 50 lines          |
//|               Short= Red over Green, Green below Yellow & 50 line|
//|                                                                  |
//|  Exit conditions*                                                |
//|   Long  = Green crosses below Red                                |
//|   Short = Green crosses above Red                                |
//|   * If Green crosses either Blue lines, consider exiting when    |
//|     when the Green line crosses back over the Blue line.         |
//|                                                                  |
//|                                                                  |
//|  IMPORTANT: The default settings are well tested and proven.     |
//|             But, you can change the settings to fit your         |
//|             trading style.                                       |
//|                                                                  |
//|  Price & Line Type settings:                                     |
//|   RSI Price settings                                             |
//|   0 = Close price     [DEFAULT]                                  |
//|   1 = Open price.                                                |
//|   2 = High price.                                                |
//|   3 = Low price.                                                 |
//|   4 = Median price, (high+low)/2.                                |
//|   5 = Typical price, (high+low+close)/3.                         |
//|   6 = Weighted close price, (high+low+close+close)/4.            |
//|                                                                  |
//|   RSI Price Line & Signal Line Type settings                     |
//|   0 = Simple moving average       [DEFAULT]                      |
//|   1 = Exponential moving average                                 |
//|   2 = Smoothed moving average                                    |
//|   3 = Linear weighted moving average                             |
//|                                                                  |
//|   Good trading,                                                  |
//|                                                                  |
//|   Dean                                                           |
//+------------------------------------------------------------------+
#property indicator_separate_window
#property indicator_buffers 7
//----
#property indicator_color1 Black
#property indicator_color2 MediumBlue
#property indicator_color3 Yellow
#property indicator_color4 MediumBlue
#property indicator_color5 Green
#property indicator_color6 Red
#property indicator_color7 Aqua
#property indicator_style7 2
//#property indicator_maximum 85
//#property indicator_minimum 15
extern bool Show_VISUAL_Alerts=true;
extern int SHIFT_Sideway=0;
extern int SHIFT_Up_Down=0;
extern int RSI_Period=13;         //8-25
extern int RSI_Price=0;           //0-6
extern int Volatility_Band=34;    //20-40
extern int RSI_Price_Line=2;
extern int RSI_Price_Type=0;      //0-3
extern int Trade_Signal_Line=7;
extern bool SHOW_Trade_Signal_Line2=true;
extern int Trade_Signal_Line2=18;
extern int Trade_Signal_Type=0;   //0-3
//----
#define UPPERLINE "UPPERLINE"
#define MEDLINE "MEDLINE"
#define LOWERLINE "LOWERLINE"
//----
double RSIBuf[],UpZone[],MdZone[],DnZone[],MaBuf[],MbBuf[],McBuf[];
//+------------------------------------------------------------------+
//|                                                                  |
//+------------------------------------------------------------------+
int init()
  {
   IndicatorShortName("Traders Dynamic Index Visual");
   SetIndexBuffer(0,RSIBuf);
   SetIndexBuffer(1,UpZone);
   SetIndexBuffer(2,MdZone);
   SetIndexBuffer(3,DnZone);
   SetIndexBuffer(4,MaBuf);
   SetIndexBuffer(5,MbBuf);
//----
   if(SHOW_Trade_Signal_Line2 ==true){SHOW_Trade_Signal_Line2=DRAW_LINE; }
   else {SHOW_Trade_Signal_Line2=DRAW_NONE; }
   SetIndexStyle(6,SHOW_Trade_Signal_Line2);
   SetIndexBuffer(6,McBuf);
   //
   SetIndexStyle(0,DRAW_NONE);
   SetIndexStyle(1,DRAW_LINE);
   SetIndexStyle(2,DRAW_LINE,0,2);
   SetIndexStyle(3,DRAW_LINE);
   SetIndexStyle(4,DRAW_LINE,0,2);
   SetIndexStyle(5,DRAW_LINE,0,1);
   //
   SetIndexLabel(0,NULL);
   SetIndexLabel(1,"VB High");
   SetIndexLabel(2,"Market Base Line");
   SetIndexLabel(3,"VB Low");
   SetIndexLabel(4,"RSI Price Line");
   SetIndexLabel(5,"Trade Signal Line");
   SetIndexLabel(6,"Trade Signal2 Line");
  /* SetLevelValue(0,50);
   SetLevelValue(1,68);
   SetLevelValue(2,32);
   SetLevelStyle(STYLE_DOT,1,DarkSlateGray);*/
   return(0);
  }
//+------------------------------------------------------------------+
//|                                                                  |
//+------------------------------------------------------------------+
int deinit()
  {
   ObjectsDeleteAll(0,OBJ_TREND);
   ObjectDelete("TDI_SIG");ObjectDelete("TDI_SIG1");ObjectDelete("TDI_SIG2");
   ObjectDelete("TDI_SIG3");ObjectDelete("TDI_SIG4");ObjectDelete("TDI_SIG5");
   ObjectDelete("TDI_SIG6");ObjectDelete("TDI_SIG7");ObjectDelete("TDI_SIG8");
   ObjectDelete("TDI_SIG9");
//----
   return(0);
  }
//+------------------------------------------------------------------+
//|                                                                  |
//+------------------------------------------------------------------+
int start()
  {
   CreateLEVEL();
  }
//+------------------------------------------------------------------+
//|                                                                  |
//+------------------------------------------------------------------+
void Createline(string objName, double start, double end, color clr)
  {
   ObjectCreate(objName, OBJ_TREND,WindowFind("Traders Dynamic Index Visual"),0, start, Time[0], end);
   ObjectSet(objName, OBJPROP_COLOR, clr);
   ObjectSet(objName, OBJPROP_STYLE, 2);
   ObjectSet(objName, OBJPROP_RAY, false);
  }
//+------------------------------------------------------------------+
//|                                                                  |
//+------------------------------------------------------------------+
   void DeleteCreateline()
  {
   ObjectDelete(UPPERLINE);ObjectDelete(LOWERLINE);ObjectDelete(MEDLINE);
  }
//+------------------------------------------------------------------+
//|                                                                  |
//+------------------------------------------------------------------+
   void CreateLEVEL()
  {
   DeleteCreateline();
   Createline(UPPERLINE, 68, 68,C'70,70,70');
   Createline(LOWERLINE, 50, 50,C'00,70,00');
   Createline(MEDLINE, 32, 32,C'70,70,70');
//----
   double MA,RSI[];
   ArrayResize(RSI,Volatility_Band);
   int counted_bars=IndicatorCounted();
   int limit=Bars-counted_bars-1;
   for(int i=limit; i>=0; i--)
     {
      RSIBuf[i]=(iRSI(NULL,0,RSI_Period,RSI_Price,i));
      MA=0;
        for(int x=i; x<i+Volatility_Band; x++)
        {
         RSI[x-i]=RSIBuf[x];
         MA+=RSIBuf[x]/Volatility_Band;
        }
      UpZone[i]=(MA + (1.6185 * StDev(RSI,Volatility_Band)));
      DnZone[i]=(MA - (1.6185 * StDev(RSI,Volatility_Band)));
      MdZone[i]=((UpZone[i] + DnZone[i])/2);
     }
   for(i=limit-1;i>=0;i--)
     {
      MaBuf[i]=(iMAOnArray(RSIBuf,0,RSI_Price_Line,0,RSI_Price_Type,i));
      MbBuf[i]=(iMAOnArray(RSIBuf,0,Trade_Signal_Line,0,Trade_Signal_Type,i));
      McBuf[i]=(iMAOnArray(RSIBuf,0,Trade_Signal_Line2,0,Trade_Signal_Type,i));
//----
      string Signal="", Signal2="",Signal2A="", Signal3="",Signal4="",Signal5="";
      color TDI_col,TDI_col2,TDI_col3,TDI_col4;
        if(Show_VISUAL_Alerts==true)
        {
         static double crossPrice;
         int crossDirection;crossDirection =0;
         //signals
         if((MaBuf[0]>MbBuf[0])&&(MbBuf[0]<MdZone[0])&&(MaBuf[0]< MdZone[0])&&(MaBuf[0]>32)&&(MaBuf[0]<68)){Signal="é";TDI_col=SeaGreen;}
         if((MaBuf[0]>MbBuf[0])&&(MbBuf[0]<MdZone[0])&&(MaBuf[0]< MdZone[0])&&(MaBuf[0]>32)&&(MaBuf[0]<68)){Signal2A="Weak Buy";TDI_col2=SeaGreen;}
         if((MaBuf[0]>MbBuf[0])&&(MbBuf[0]<MdZone[0])&&(MaBuf[0]< MdZone[0])&&(MaBuf[0]>32)&&(MaBuf[0]<68)){Signal2=" @ "+DoubleToStr(crossPrice,Digits)+"";TDI_col2=SeaGreen;}
         if((MaBuf[0]>MbBuf[0])&&(MbBuf[0]<MdZone[0])&&(MaBuf[0]< MdZone[0])&&(MaBuf[0]>32)&&(MaBuf[0]<68)){crossPrice=Bid;crossDirection =2;}
         //
         if((MaBuf[0]<MbBuf[0])&&(MbBuf[0]> MdZone[0])&&(MaBuf[0]> MdZone[0])&&(MaBuf[0]>32)&&(MaBuf[0]<68)){Signal="ê";TDI_col=Orange;}
         if((MaBuf[0]<MbBuf[0])&&(MbBuf[0]> MdZone[0])&&(MaBuf[0]> MdZone[0])&&(MaBuf[0]>32)&&(MaBuf[0]<68)){Signal2A="Weak Sell";TDI_col2=Orange;}
         if((MaBuf[0]<MbBuf[0])&&(MbBuf[0]> MdZone[0])&&(MaBuf[0]> MdZone[0])&&(MaBuf[0]>32)&&(MaBuf[0]<68)){Signal2=" @ "+DoubleToStr(crossPrice,Digits)+"";TDI_col2=Orange;}
         if((MaBuf[0]<MbBuf[0])&&(MbBuf[0]> MdZone[0])&&(MaBuf[0]> MdZone[0])&&(MaBuf[0]>32)&&(MaBuf[0]<68)){crossPrice=Bid;crossDirection =1;}
         //
         if((MaBuf[0]>MbBuf[0])&&(MbBuf[0]> MdZone[0])&&(MaBuf[0]>32)&&(MaBuf[0]<68)){Signal="é";TDI_col=Lime;}
         if((MaBuf[0]>MbBuf[0])&&(MbBuf[0]> MdZone[0])&&(MaBuf[0]>32)&&(MaBuf[0]<68)){Signal2A="Strong Buy";TDI_col2=Lime;}
         if((MaBuf[0]>MbBuf[0])&&(MbBuf[0]> MdZone[0])&&(MaBuf[0]>32)&&(MaBuf[0]<68)){Signal2=" @ "+DoubleToStr(crossPrice,Digits)+"";TDI_col2=Lime;}
         if((MaBuf[0]>MbBuf[0])&&(MbBuf[0]> MdZone[0])&&(MaBuf[0]>32)&&(MaBuf[0]<68)){crossPrice=Bid;crossDirection =2;}
         //
         if((MaBuf[0]>MbBuf[0])&&(MaBuf[0]> MdZone[0])&&(MbBuf[0]< MdZone[0])&&(MaBuf[0]>32)&&(MaBuf[0]<68)){Signal2A="Medium Buy";TDI_col2=Green;}
         if((MaBuf[0]>MbBuf[0])&&(MaBuf[0]> MdZone[0])&&(MbBuf[0]< MdZone[0])&&(MaBuf[0]>32)&&(MaBuf[0]<68)){Signal2=" @ "+DoubleToStr(crossPrice,Digits)+"";TDI_col2=Green;}
         if((MaBuf[0]>MbBuf[0])&&(MaBuf[0]> MdZone[0])&&(MbBuf[0]< MdZone[0])&&(MaBuf[0]>32)&&(MaBuf[0]<68)){Signal5="é";TDI_col2=Green;}
         if((MaBuf[0]>MbBuf[0])&&(MaBuf[0]> MdZone[0])&&(MbBuf[0]< MdZone[0])&&(MaBuf[0]>32)&&(MaBuf[0]<68)){crossPrice=Bid;crossDirection =2;}
         //
         if((MaBuf[0]<MbBuf[0])&&(MbBuf[0]< MdZone[0])&&(MaBuf[0]>32)&&(MaBuf[0]<68)){Signal="ê";TDI_col=Red;}
         if((MaBuf[0]<MbBuf[0])&&(MbBuf[0]< MdZone[0])&&(MaBuf[0]>32)&&(MaBuf[0]<68)){Signal2A="Strong Sell";TDI_col2=Red;}
         if((MaBuf[0]<MbBuf[0])&&(MbBuf[0]< MdZone[0])&&(MaBuf[0]>32)&&(MaBuf[0]<68)){Signal2=" @ "+DoubleToStr(crossPrice,Digits)+"";TDI_col2=Red;}
         if((MaBuf[0]<MbBuf[0])&&(MbBuf[0]< MdZone[0])&&(MaBuf[0]>32)&&(MaBuf[0]<68)){crossPrice=Bid;crossDirection =1;}
         //
         if((MaBuf[0]<MbBuf[0])&&(MaBuf[0]< MdZone[0])&&(MbBuf[0]> MdZone[0])&&(MaBuf[0]>32)&&(MaBuf[0]<68)){Signal2A="Medium Sell";TDI_col2=Tomato;}
         if((MaBuf[0]<MbBuf[0])&&(MaBuf[0]< MdZone[0])&&(MbBuf[0]> MdZone[0])&&(MaBuf[0]>32)&&(MaBuf[0]<68)){Signal2=" @ "+DoubleToStr(crossPrice,Digits)+"";TDI_col2=Tomato;}
         if((MaBuf[0]<MbBuf[0])&&(MaBuf[0]< MdZone[0])&&(MbBuf[0]> MdZone[0])&&(MaBuf[0]>32)&&(MaBuf[0]<68)){Signal5="ê";TDI_col2=Tomato;}
         if((MaBuf[0]<MbBuf[0])&&(MaBuf[0]< MdZone[0])&&(MbBuf[0]> MdZone[0])&&(MaBuf[0]>32)&&(MaBuf[0]<68)){crossPrice=Bid;crossDirection =1;}
         // reversals
         if(MaBuf[0]>=68){Signal="ê";TDI_col=Red;}
         if(MaBuf[0]>=68){crossPrice=Bid;crossDirection =2;}
         if(MaBuf[0]>=68){Signal2A="Caution !";TDI_col2=Red;}
         if(MaBuf[0]>=68){Signal2=" @ "+DoubleToStr(crossPrice,Digits)+"";TDI_col2=Red;}
         if(MaBuf[0]<=32){Signal="é";TDI_col=Red;}
         if(MaBuf[0]<=32){crossPrice=Bid;crossDirection =1;}
         if(MaBuf[0]<=32){Signal2A="Caution !";TDI_col2=Red;}
         if(MaBuf[0]<=32){Signal2=" @ "+DoubleToStr(crossPrice,Digits)+"";TDI_col2=Red;}
         //trend
         if(MbBuf[0]>MdZone[0]){Signal3="é";TDI_col3=Lime;}
         if((MbBuf[0]<MdZone[0])&&(MaBuf[0]>MdZone[0])){Signal3="é";TDI_col3=Orange;}
         if(MbBuf[0]<MdZone[0]){Signal3="ê";TDI_col3=Red;}
         if((MbBuf[0]>MdZone[0])&&(MaBuf[0]<MdZone[0])){Signal3="é";TDI_col3=Green;}
         //ranging
         if(UpZone[0]-DnZone[i]<20){Signal4="Consolidation";TDI_col4=Silver;}
         ObjectDelete("TDI_SIG");
         ObjectCreate("TDI_SIG", OBJ_LABEL,WindowFind("Traders Dynamic Index Visual"), 0, 0);
         ObjectSetText("TDI_SIG",Signal, 25, "Wingdings",TDI_col );
         ObjectSet("TDI_SIG", OBJPROP_CORNER, 1);
         ObjectSet("TDI_SIG", OBJPROP_XDISTANCE, 80+SHIFT_Sideway);
         ObjectSet("TDI_SIG", OBJPROP_YDISTANCE, 20+SHIFT_Up_Down);
         //
         ObjectDelete("TDI_SIG1");
         ObjectCreate("TDI_SIG1", OBJ_LABEL,WindowFind("Traders Dynamic Index Visual"), 0, 0);
         ObjectSetText("TDI_SIG1",Signal2A  + Signal5  + Signal2 , 15, "Tahoma Narrow",TDI_col2);
         ObjectSet("TDI_SIG1", OBJPROP_CORNER, 1);
         ObjectSet("TDI_SIG1", OBJPROP_XDISTANCE, 120+SHIFT_Sideway);
         ObjectSet("TDI_SIG1", OBJPROP_YDISTANCE, 30+SHIFT_Up_Down);
         //
         /*
         ObjectDelete("TDI_SIG2");
         ObjectCreate("TDI_SIG2", OBJ_LABEL,WindowFind("Traders Dynamic Index Visual"), 0, 0);
         ObjectSetText("TDI_SIG2",Signal2A, 15, "Tahoma Narrow",TDI_col2);
         ObjectSet("TDI_SIG2", OBJPROP_CORNER, 1);
         ObjectSet("TDI_SIG2", OBJPROP_XDISTANCE, 120+SHIFT_Sideway);
         ObjectSet("TDI_SIG2", OBJPROP_YDISTANCE, 10+SHIFT_Up_Down);
         */
         //
         /*
         ObjectDelete("TDI_SIG3");
         ObjectCreate("TDI_SIG3", OBJ_LABEL,WindowFind("Traders Dynamic Index Visual"), 0, 0);
         ObjectSetText("TDI_SIG3",Signal5, 25, "Wingdings",TDI_col2 );
         ObjectSet("TDI_SIG3", OBJPROP_CORNER, 1);
         ObjectSet("TDI_SIG3", OBJPROP_XDISTANCE, 80+SHIFT_Sideway);
         ObjectSet("TDI_SIG3", OBJPROP_YDISTANCE, 20+SHIFT_Up_Down);
         */
         //
         /*
         ObjectDelete("TDI_SIG4");
         ObjectCreate("TDI_SIG4", OBJ_LABEL,WindowFind("Traders Dynamic Index Visual"), 0, 0);
         ObjectSetText("TDI_SIG4",Signal3 + " signal3", 25, "Tahoma Narrow",TDI_col3 );
         ObjectSet("TDI_SIG4", OBJPROP_CORNER, 1);
         ObjectSet("TDI_SIG4", OBJPROP_XDISTANCE, 80+SHIFT_Sideway);
         ObjectSet("TDI_SIG4", OBJPROP_YDISTANCE, 55+SHIFT_Up_Down);
         */
         //
         /*
         ObjectDelete("TDI_SIG5");
         ObjectCreate("TDI_SIG5", OBJ_LABEL,WindowFind("Traders Dynamic Index Visual"), 0, 0);
         ObjectSetText("TDI_SIG5","TDI Trend", 15, "Tahoma Narrow",TDI_col3 );
         ObjectSet("TDI_SIG5", OBJPROP_CORNER, 1);
         ObjectSet("TDI_SIG5", OBJPROP_XDISTANCE, 120+SHIFT_Sideway);
         ObjectSet("TDI_SIG5", OBJPROP_YDISTANCE, 60+SHIFT_Up_Down);
         */
         //
         /*
         ObjectDelete("TDI_SIG6");
         ObjectCreate("TDI_SIG6", OBJ_LABEL,WindowFind("Traders Dynamic Index Visual"), 0, 0);
         ObjectSetText("TDI_SIG6",Signal4, 15, "Tahoma Narrow",TDI_col4 );
         ObjectSet("TDI_SIG6", OBJPROP_CORNER, 1);
         ObjectSet("TDI_SIG6", OBJPROP_XDISTANCE, 100+SHIFT_Sideway);
         ObjectSet("TDI_SIG6", OBJPROP_YDISTANCE, 100+SHIFT_Up_Down);
         */
         }

      //line numbers
      ObjectDelete("TDI_SIG7");
      ObjectDelete("TDI_SIG7");
        if(ObjectFind("TDI_SIG7")!=0)
        {
         ObjectCreate("TDI_SIG7", OBJ_TEXT,WindowFind("Traders Dynamic Index Visual"), Time[0],70);
         ObjectSetText("TDI_SIG7","          68 ",7, "Tahoma Narrow",CadetBlue);
        }
         else
         {
         ObjectMove("TDI_SIG7", 0, Time[0], 70);
         }
      ObjectDelete("TDI_SIG8");
      ObjectDelete("TDI_SIG8");
        if(ObjectFind("TDI_SIG8")!=0)
        {
         ObjectCreate("TDI_SIG8", OBJ_TEXT,WindowFind("Traders Dynamic Index Visual"), Time[0],52);
         ObjectSetText("TDI_SIG8","          50 ",7, "Tahoma Narrow",CadetBlue);
        }
         else
         {
         ObjectMove("TDI_SIG8", 0, Time[0], 52);
         }
      ObjectDelete("TDI_SIG9");
      ObjectDelete("TDI_SIG9");
        if(ObjectFind("TDI_SIG9")!=0)
        {
         ObjectCreate("TDI_SIG9", OBJ_TEXT,WindowFind("Traders Dynamic Index Visual"), Time[0],34);
         ObjectSetText("TDI_SIG9","          32 ",7, "Tahoma Narrow",CadetBlue);
        }
         else
         {
          ObjectMove("TDI_SIG9", 0, Time[0], 34);
         }
     }
//----
   return(0);
  }
//+------------------------------------------------------------------+
//|                                                                  |
//+------------------------------------------------------------------+
double StDev(double& Data[], int Per)
  {
  return(MathSqrt(Variance(Data,Per)));
  }
//+------------------------------------------------------------------+
//|                                                                  |
//+------------------------------------------------------------------+
double Variance(double& Data[], int Per)
  {
   double sum, ssum;
    for(int i=0; i<Per; i++)
     {
      sum+=Data[i];
      ssum+=MathPow(Data[i],2);
     }
   return((ssum*Per - sum*sum)/(Per*(Per-1)));
  }
//+------------------------------------------------------------------+
Comments