to_ind_Adjustable_Trading_Bands
Download script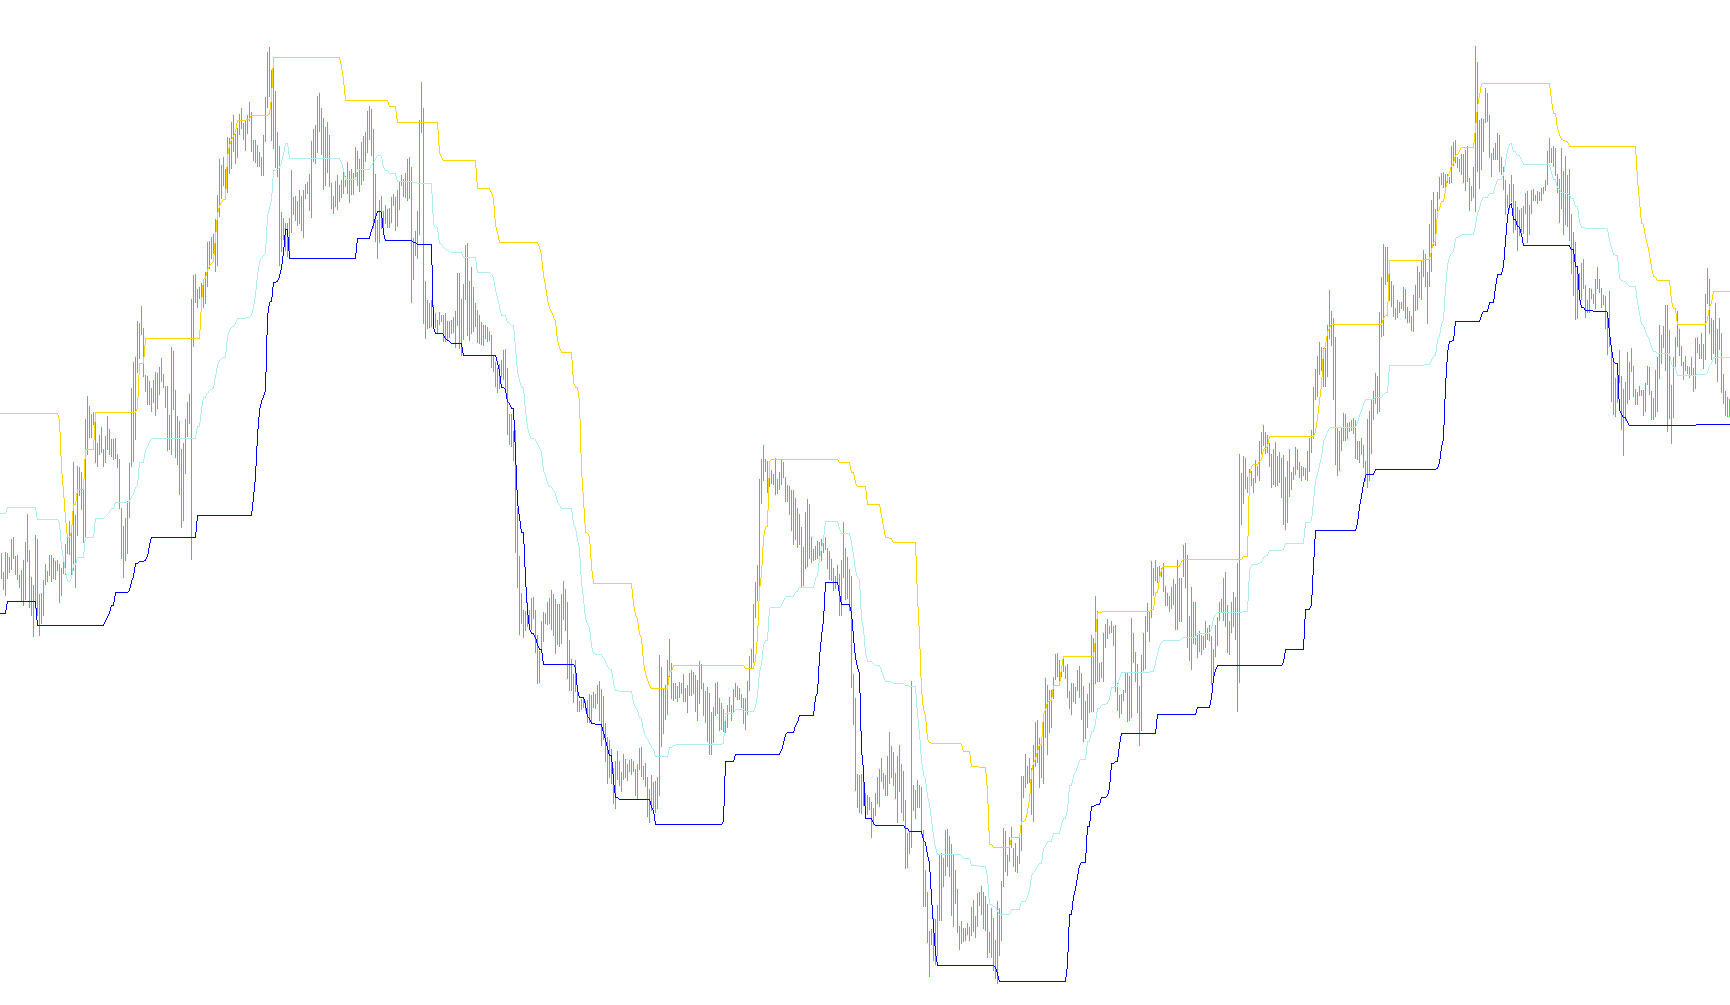
This technical tool is designed to create a dynamic trading band on your price chart, helping you visualize market volatility and identify potential price boundaries. Rather than using static levels, the script calculates "smart" bands that expand and contract based on actual market movement.
How the Logic Works
The tool operates by analyzing three distinct layers of market data to determine where the price is likely to move:
1. Volatility Measurement (ATR) The script begins by measuring the current "pulse" of the market using a volatility indicator. This helps the tool understand if the market is moving calmly or experiencing sudden, sharp spikes. It uses this information to set the width of the trading bands; when volatility is high, the bands widen, and when it is low, the bands tighten.
2. High and Low Point Identification The logic constantly scans recent price history to identify local peaks (highs) and troughs (lows). It then takes these points and applies a mathematical adjustment based on the volatility measured in the first step. This creates "adjusted" high and low boundaries that are responsive to current market conditions.
3. Trend Smoothing and Band Construction To prevent the bands from jumping erratically, the script applies a secondary smoothing layer. It looks at the adjusted highs and lows over a specific period to find the most significant extreme levels. These results are then used to plot three distinct lines on your chart:
- Upper Band: Represents the dynamic ceiling of the current price range.
- Lower Band: Represents the dynamic floor of the current price range.
- Central Line: This is the mathematical average of the Upper and Lower bands, providing a "fair value" or equilibrium point for the market.
Summary for Traders
In practical terms, this script provides you with a visual "tunnel." When the price stays within these bands, it suggests the market is in a standard range. If the price pushes toward or breaks through the Upper or Lower bands, it indicates that the market is moving beyond its recent normal volatility, potentially signaling a trend change or an overextended move.
//+------------------------------------------------------------------+
//|                             to_ind_Adjustable_Trading_Bands .mq4 |
//|                                                                * |
//|                                                                * |
//+------------------------------------------------------------------+
#property copyright "http://dmffx.com"
#property link      "http://dmffx.com"

#property indicator_chart_window
#property indicator_buffers 3
#property indicator_color1 DodgerBlue
#property indicator_color2 Red
#property indicator_color3 Khaki
//---- input parameters
extern int       ATRPeriod=5; // Ïåðèîä îïðåäåëåíèÿ ìàêñèìóìà/ìèíèìóìà öåíû
extern double    ATRFactor=1.5; // Êîýýôèöèåíò óðîâíÿ êîððåêöèè ìàêñèìóìà/ìèíèìóìà öåíû çíà÷åíèåì ATR
extern int       ATRHLPeriod=5; // Ïåðèîä ATR êîððåêòèðóþùåãî çíà÷åíèÿ ìàêñèìóìà/ìèíèìóìà öåíû
extern int       HLPeriod=34; // Ïåðèîä îïðåäåëåíèÿ ìàêñèìóìà/ìèíèìóìà öåíû îòêîððåêòèðîâàííîé ïî ATR
//---- buffers
double ExtMapBuffer1[];
double ExtMapBuffer2[];
double ExtMapBuffer3[];
double LLV_Pl_ATR[];
double HHV_Mn_ATR[];

//+------------------------------------------------------------------+
//| Custom indicator initialization function                         |
//+------------------------------------------------------------------+
int init()
  {
//---- indicators
   IndicatorBuffers(5);

   SetIndexStyle(0,DRAW_LINE);
   SetIndexBuffer(0,ExtMapBuffer1);
   SetIndexStyle(1,DRAW_LINE);
   SetIndexBuffer(1,ExtMapBuffer2);
   SetIndexStyle(2,DRAW_LINE);
   SetIndexBuffer(2,ExtMapBuffer3);

   SetIndexBuffer(3,LLV_Pl_ATR);
   SetIndexBuffer(4,HHV_Mn_ATR);

   SetIndexLabel(0,"ATB Upper");
   SetIndexLabel(1,"ATB Lower");
   SetIndexLabel(2,"ATB Central");

//----
   return(0);
  }
//+------------------------------------------------------------------+
//| Custom indicator deinitialization function                       |
//+------------------------------------------------------------------+
int deinit()
  {
//----

//----
   return(0);
  }
//+------------------------------------------------------------------+
//| Custom indicator iteration function                              |
//+------------------------------------------------------------------+
int start()
  {
   int    limit=Bars-IndicatorCounted();

      for(int i=limit-1;i>=0;i--){
         LLV_Pl_ATR[i]=Low[Lowest(NULL,0,MODE_LOW,ATRPeriod,i)]+ATRFactor*iATR(NULL,0,ATRHLPeriod,i);
         HHV_Mn_ATR[i]=High[Highest(NULL,0,MODE_HIGH,ATRPeriod,i)]-ATRFactor*iATR(NULL,0,ATRHLPeriod,i);
      }
      for(i=limit-1;i>=0;i--){
         ExtMapBuffer1[i]=LLV_Pl_ATR[ArrayMaximum(LLV_Pl_ATR,HLPeriod,i)];
         ExtMapBuffer2[i]=HHV_Mn_ATR[ArrayMinimum(HHV_Mn_ATR,HLPeriod,i)];
         ExtMapBuffer3[i]=(ExtMapBuffer1[i]+ExtMapBuffer2[i])/2;
      }

//----

//----
   return(0);
  }
//+------------------------------------------------------------------+
Comments