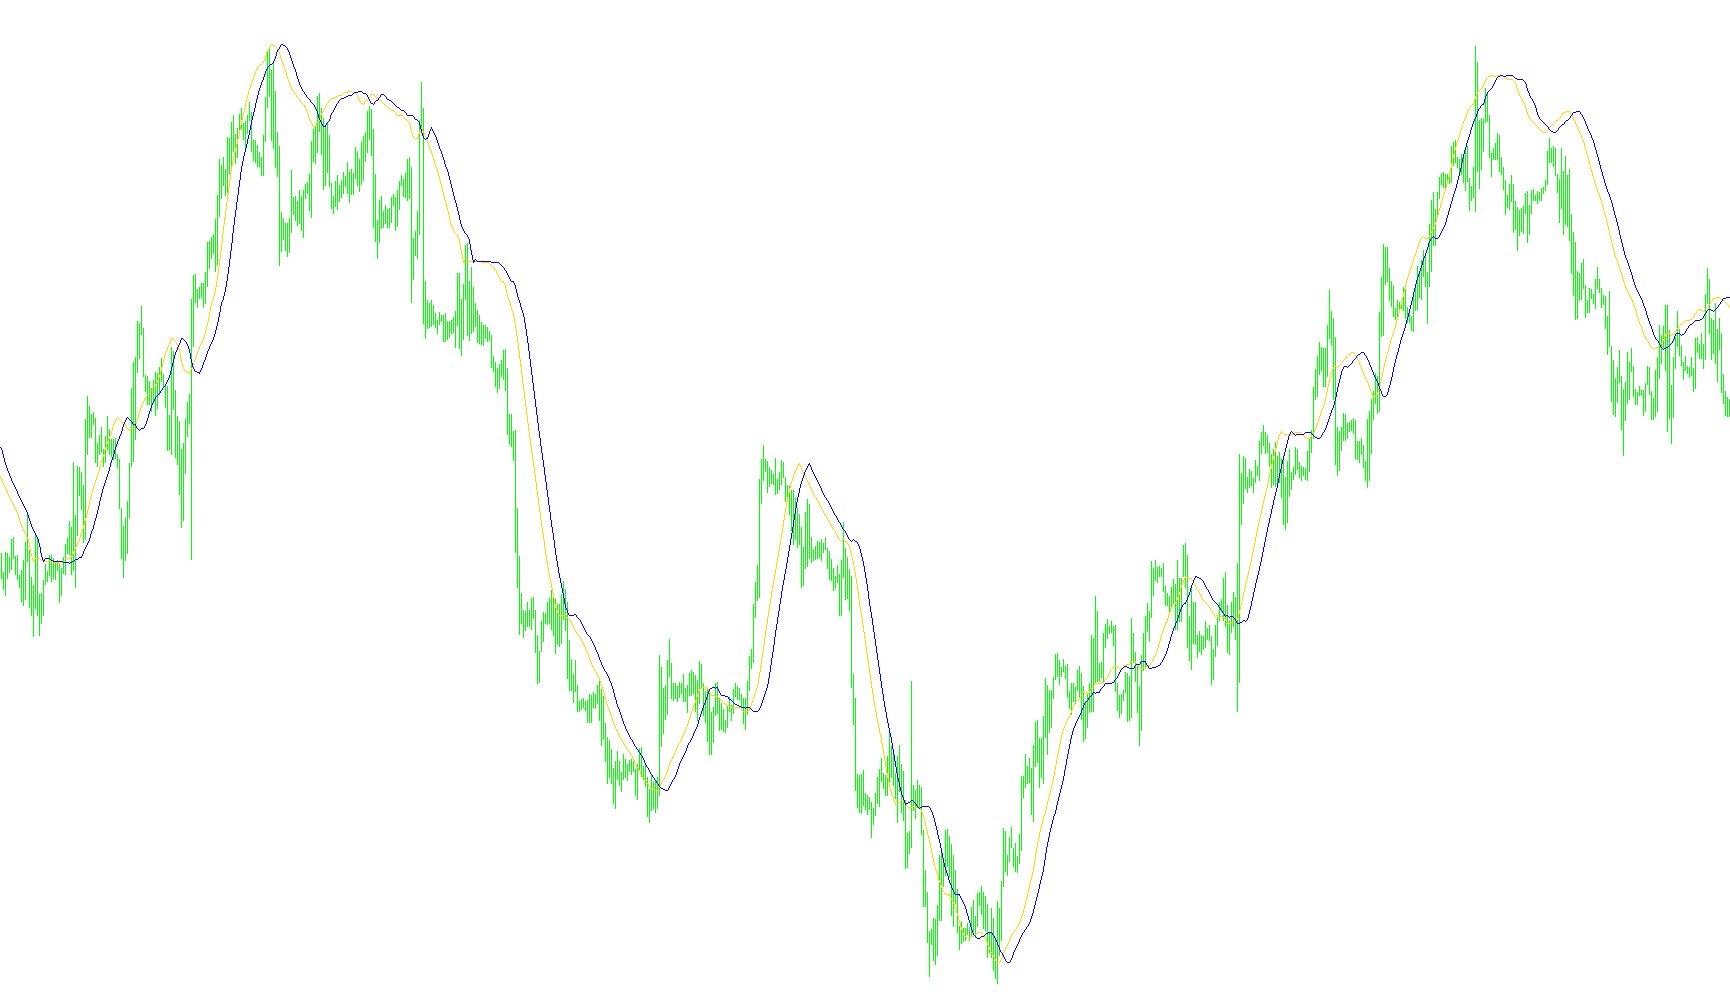
This technical tool is designed to provide traders with a visual representation of market momentum and price trends by calculating two distinct moving averages simultaneously. By isolating these values into a separate window on your trading platform, it allows for a clearer analysis of price behavior without cluttering the main chart.
How the Logic Works
The script operates by processing historical price data to generate two different lines based on specific mathematical offsets:
- The Primary Trend Line: The tool first calculates a standard moving average based on a user-defined period (defaulting to 21 bars). This line reflects the general direction of the price action over that specific timeframe.
- The Delayed Trend Line: Simultaneously, the tool calculates a second moving average using the same period but applies a "shift" or "offset" (defaulting to 5 bars back). This creates a secondary line that tracks the trend from a slightly different point in time.
Practical Application for Traders
By plotting these two lines together, the tool highlights the relationship between current price trends and recent historical data. When you view these lines on your screen, the interaction between the standard moving average and its shifted counterpart helps identify:
- Trend Strength: How quickly or smoothly the current price is moving relative to its recent past.
- Momentum Shifts: Visual cues where the two lines diverge or converge, which can indicate potential changes in market sentiment.
- Price Smoothing: By using a Simple Moving Average (SMA) calculation, the tool filters out "noise" (minor, insignificant price fluctuations), allowing you to see the broader underlying trend more clearly.
In summary, this script acts as a momentum tracker that simplifies complex price movements into two clean visual lines, helping you distinguish between temporary price spikes and sustained market trends.
//+------------------------------------------------------------------+
//|                                                        SmCCI.mq4 |
//|                      Copyright © 2006, MetaQuotes Software Corp. |
//|                                        http://www.metaquotes.net |
//+------------------------------------------------------------------+
#property copyright "Copyright © 2006, MetaQuotes Software Corp."
#property link      "http://www.metaquotes.net"

#property indicator_separate_window
#property indicator_buffers 2
#property indicator_color1 Red
#property indicator_color2 Lime
//---- input parameters

extern int       per=21;
/*extern int       nBar=300;*/
extern int       sdvig=5;
//---- buffers
double ExtMapBuffer1[];
double ExtMapBuffer2[];
double malim, mared;

//+------------------------------------------------------------------+
//| Custom indicator initialization function                         |
//+------------------------------------------------------------------+
int init()
  {
//---- indicators
   SetIndexStyle(0,DRAW_LINE);
   SetIndexBuffer(0,ExtMapBuffer1);
   SetIndexStyle(1,DRAW_LINE);
   SetIndexBuffer(1,ExtMapBuffer2);
//----
   return(0);
  }
//+------------------------------------------------------------------+
//| Custom indicator iteration function                              |
//+------------------------------------------------------------------+
int start()
  {
   int limit;
   int counted_bars=IndicatorCounted();
      //---- check for possible errors
   if(counted_bars<0) return(-1);
      //---- last counted bar will be recounted
   if(counted_bars>0) counted_bars--;
   limit=Bars-counted_bars;
      //---- macd counted in the 1-st buffer
   for(int i=0; i<limit; i++)

   {
      malim=iMA(NULL,0,per,0,MODE_SMA,PRICE_CLOSE,i);
      mared=iMA(NULL,0,per,0,MODE_SMA,PRICE_CLOSE,i+sdvig);
      ExtMapBuffer1[i]=malim;
      ExtMapBuffer2[i]=mared;
   }

   return(0);
  }
//+------------------------------------------------------------------+
Comments