Today_Trend_last
Download script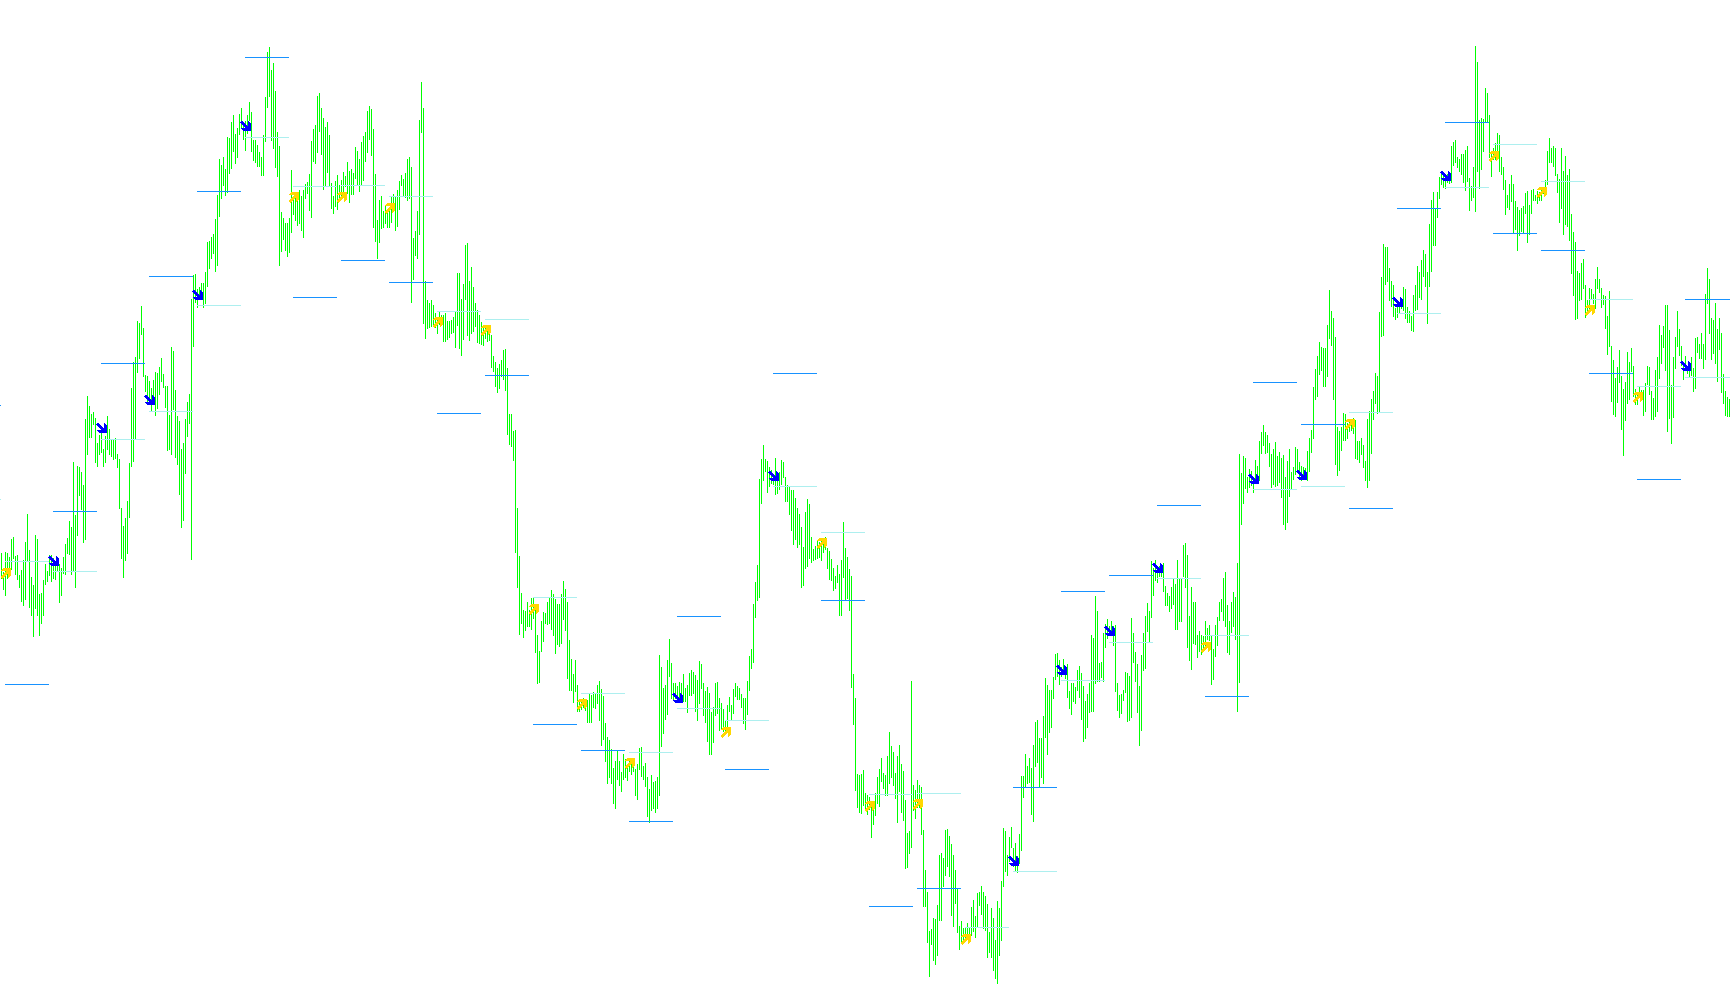
This script is designed to analyze market trends and identify specific trading opportunities based on the price action of the previous trading day. It primarily focuses on "Opening of Day" logic, meaning it looks for cues at the very start of a new session to determine whether the current momentum favors a buying or selling position.
Core Logic and Mechanics
Data Analysis The tool begins by looking back at the previous day's price data, specifically identifying three key points: the High, the Low, and the Closing price. Using these figures, it calculates several mathematical "pivot" levels. These pivots act as imaginary boundaries to help determine where support (the floor) and resistance (the ceiling) might be for the current day.
Decision Making Process The script evaluates the current opening price against these calculated levels through a three-step hierarchical logic:
- Primary Action: It first checks if the opening price falls within certain ranges relative to the previous day's high and low.
- Secondary Action: If the primary conditions are met, it looks deeper at whether the price is closer to the "Support" or "Resistance" levels to refine the direction.
- Tertiary Action: As a final check, it looks at extreme breakouts—specifically if the price opens significantly above or below the previous day's range.
The script prioritizes these actions in a specific order: if the second level of logic provides a signal, it overrides the first; if the third level provides a signal, it takes precedence over both.
Visual Outputs and Goals Based on the results of this logic, the tool provides several visual aids on your chart:
- Directional Signals: It places arrows on the chart to indicate whether the calculated trend is "Go Long" (Buy) or "Go Short" (Sell).
- Profit Targets: Depending on your settings, it can draw a line indicating a specific price target based on a user-defined profit goal.
- Reversal Points: It identifies a "Reversal Rate," which acts as a visual marker for where the current trend might exhaust or flip in the opposite direction.
Summary of Usage
The tool is intended to simplify the decision-making process at the start of a trading day. By automating the calculation of pivot points and comparing the opening price against those levels, it provides a clear "Buy" or "Sell" orientation while simultaneously marking out your potential profit targets and danger zones (reversal points) on the chart.
//+------------------------------------------------------------------+
//|                                                  Today Trend.mq4 |
//|                                   Copyright © 2006, Jason Rivera |
//|                                      http://www.jasonerivera.com |
//+------------------------------------------------------------------+
//  Based on an excel spreadsheet posted by toro55 @
//  http://www.strategybuilderfx.com/forums/showthread.php?s=&threadid=16130
//  Posted for the benefit of those at the StrategyBuilder
//  community.
#property copyright "Copyright © 2006, Jason Rivera"
#property link      "http://www.jasonerivera.com"
//----
#property indicator_chart_window
#property indicator_buffers 4
#property indicator_color1 Blue
#property indicator_color2 Red
#property indicator_color3 YellowGreen
#property indicator_color4 Red
//----External Variables
extern int PROFIT_TARGET=30;
extern bool SHOW_TARGET=true;
extern bool SHOW_REVERSAL=true;
//---- buffers
double UpBuffer[];
double DownBuffer[];
double TargetBuffer[];
double ReversalBuffer[];
//----variables
double H=0, L=0, O=0, C=0, R=0, S=0, Pivot=0, Spread=0, RevRate=0, MaxLoss=0, max=0, draw=0;
double S2,R2;
int action=0, action1=0, action2=0, action3=0;
int Under_Resistance=0;
string res="";
//+------------------------------------------------------------------+
//| Custom indicator initialization function                         |
//+------------------------------------------------------------------+
int init()
  {
//---- indicators
   SetIndexLabel(0,"Go Long");
   SetIndexLabel(1,"Go Short");
   SetIndexLabel(2,"Profit Target Line");
   SetIndexLabel(3,"Stop/Reversal Line");
   SetIndexStyle(0,DRAW_ARROW,STYLE_SOLID,1);
   SetIndexBuffer(0,UpBuffer);
   SetIndexStyle(1,DRAW_ARROW,STYLE_SOLID,1);
   SetIndexBuffer(1,DownBuffer);
   SetIndexStyle(2,DRAW_LINE,STYLE_SOLID,1);
   SetIndexBuffer(2,TargetBuffer);
   SetIndexStyle(3,DRAW_LINE,STYLE_SOLID,1);
   SetIndexBuffer(3,ReversalBuffer);
//----
   SetIndexEmptyValue(0,0);
   SetIndexEmptyValue(1,0);
   SetIndexEmptyValue(2,0);
   SetIndexEmptyValue(3,0);
   SetIndexArrow(0,236);
   SetIndexArrow(1,238);
//----
   return(0);
  }
//+------------------------------------------------------------------+
//| Custom indicator deinitialization function                       |
//+------------------------------------------------------------------+
int deinit()
  {
//----
//----
   return(0);
  }
//+------------------------------------------------------------------+
//| Custom indicator iteration function                              |
//+------------------------------------------------------------------+
int start()
  {
   int    counted_bars=IndicatorCounted();
   int pos =0;
   int m=0;
   int d=0;
   int y=0;
   string dt="";
   datetime some_time=0;
   int shift=0;
   int tc=1440;
   int min=0;
   int hr=0;
   int thour=0, tmin=0;
//----
   //script can only be run on daily chart or lower timeframe
   if(Period() > 1440)
     {
      Print("Indicator must be run on Daily chart or lesser timeframe");
      return(0);
     }
//---- check for possible errors
   if(counted_bars<0) return(-1);
//---- last counted bar will be recounted
   if(counted_bars>0) counted_bars--;
//----
   pos=Bars-counted_bars;
//----
   while(pos>=0)
     {
      m=TimeMonth(Time[pos]);
      d=TimeDay(Time[pos]);
      y=TimeYear(Time[pos]);
      min=TimeMinute(Time[pos]);
      hr=TimeHour(Time[pos]);
      dt=y + "." + m + "." + d + " " + hr + ":" + min;
      some_time=StrToTime(dt);
      //find the proper shift of the daily bar having the same date as this timeframe's bar having the current shift
      //we must do this in order to be able to run the indicator on smaller time frames in light of a bigger one
      shift=iBarShift(NULL,tc,some_time); //returns the correct shift of the current daily bar
      thour=TimeHour(iTime(NULL,60,iBarShift(NULL,60,some_time)));
      tmin=TimeMinute(iTime(NULL,Period(),pos));
      //create price reference lines
      if(SHOW_REVERSAL==true) {ReversalBuffer[pos]=ReversalBuffer[pos+1];}
      if(SHOW_TARGET==true) {TargetBuffer[pos]=TargetBuffer[pos+1];}
      //only trade on Open of Day; check for hour 0 && minute 0 for intraday timeframes
      if(thour==0 && tmin==0)
        {
         H=iHigh(NULL,tc,shift+1);   //previous daily bar's high
         L=iLow(NULL,tc,shift+1);    //previous daily bar's low
         C=iClose(NULL,tc,shift+1);  //previous daily bar's close
         O=Open[pos];                //current Period() bar's open
//----
         Spread=H - L;
/*
         Pivot = (Spread*2)/5;
         R = H - Pivot;
         S = L + Pivot;
*/
         Pivot=(H + L + C)/3;
         R=2*Pivot - L;
         S=2*Pivot - H;
         S2=Pivot - (R - S);
         R2=Pivot + (R-S);
         //reset Buy/Sell actions
         action1=0;
         action2=0;
         action3=0;
         Under_Resistance=0;
//----
         if(O < R)
           {
            Under_Resistance=1;
            }
               else
            {
            Under_Resistance=-1;
           }
         //Calculate the 1st action
         if(O < H && O > R) action1=-1;  //"Sell"
         if(O > L && O < S) action1=1;   //"Buy"
         //Calculate the 2nd action
         if(Under_Resistance==1 && (R-O) < (O-S)) action2=-1;   //"Sell"
         if(Under_Resistance==1 && (R-O)>=(O-S)) action2=1;   //"Buy"
         //Calculate the 3rd action
         if(O<=L) action3=-1;  //"Sell"
         if(O>=H) action3=1;   //"Buy"
         //Calculate the Reversal Rate
/*
         if(action2 == 1) RevRate = L;
         if(action2 == -1) RevRate = H;
         if(action1 == -1) RevRate = H;
         if(action1 == 1) RevRate = L;
         if(action3 == 1) RevRate = H;
         if(action3 == -1) RevRate = L;
*/
         if(action2==1) RevRate=S;
         if(action2==-1) RevRate=R;
         if(action1==-1) RevRate=R2;
         if(action1==1) RevRate=S2;
         if(action3==1)
           {
            if(O<=R2) RevRate=H;
            if(O > R2) RevRate=R2;
           }
         if(action3==-1)
           {
            if(O>=S2) RevRate=L;
            if(O < S2) RevRate=S2;
           }
         //Calculate the Max Loss
         if(action2==1) MaxLoss=O - S;
         if(action2==-1) MaxLoss=R - O;
         if(action1==-1) MaxLoss=R2 - O;
         if(action1==1) MaxLoss=O - S2;
         if(action3==1)
           {
            if(O<=R2) MaxLoss=O - H;
            if(O > R2) MaxLoss=O - R2;
           }
         if(action3==-1)
           {
            if(O<=R2) MaxLoss=L - O;
            if(O > R2) MaxLoss=S2 - O;
           }
/*
         if(action2 == 1) MaxLoss = O - L;
         if(action2 == -1) MaxLoss = H - O;
         if(action1 == -1) MaxLoss = H - O;
         if(action1 == 1) MaxLoss = O - L;
         if(action3 == 1) MaxLoss = O - H;
         if(action3 == -1) MaxLoss = L - O;
*/
         if(action1!=0)  action=action1;
         if(action2!=0)  action=action2;
         if(action3!=0)  action=action3;
         if(action==1)//buy
           {
            UpBuffer[pos]=O;
//----
            if(SHOW_TARGET==true)
              {
               TargetBuffer[pos+1]=0;  //keep line from warping to next value; comment line to see on daily timeframe
               TargetBuffer[pos]=O + (PROFIT_TARGET*Point);
              }
            if(SHOW_REVERSAL==true)
              {
               ReversalBuffer[pos+1]=0;   //keep line from warping to next value; comment line to see on daily timeframe
               ReversalBuffer[pos]=RevRate;
              }
           }
         if(action==-1)//sell
           {
            DownBuffer[pos]=O;
//----
            if(SHOW_TARGET==true)
              {
               TargetBuffer[pos+1]=0;  //keep line from warping to next value; comment line to see on daily timeframe
               TargetBuffer[pos]=O - (PROFIT_TARGET*Point);
              }
            if(SHOW_REVERSAL==true)
              {
               ReversalBuffer[pos+1]=0;   //keep line from warping to next value; comment line to see on daily timeframe
               ReversalBuffer[pos]=RevRate;
              }
           }
        }
      pos--;
     }
   Comment(ToString(action), " @ ", O);
//----
   return(0);
  }
string ToString(int action)
  {
   if(action==1) return("Buy");
   if(action==-1) return("Sell");
   if(action==0) return("No Action");
  }
//+------------------------------------------------------------------+
Comments