Regression_Channel_V2_v2
Download script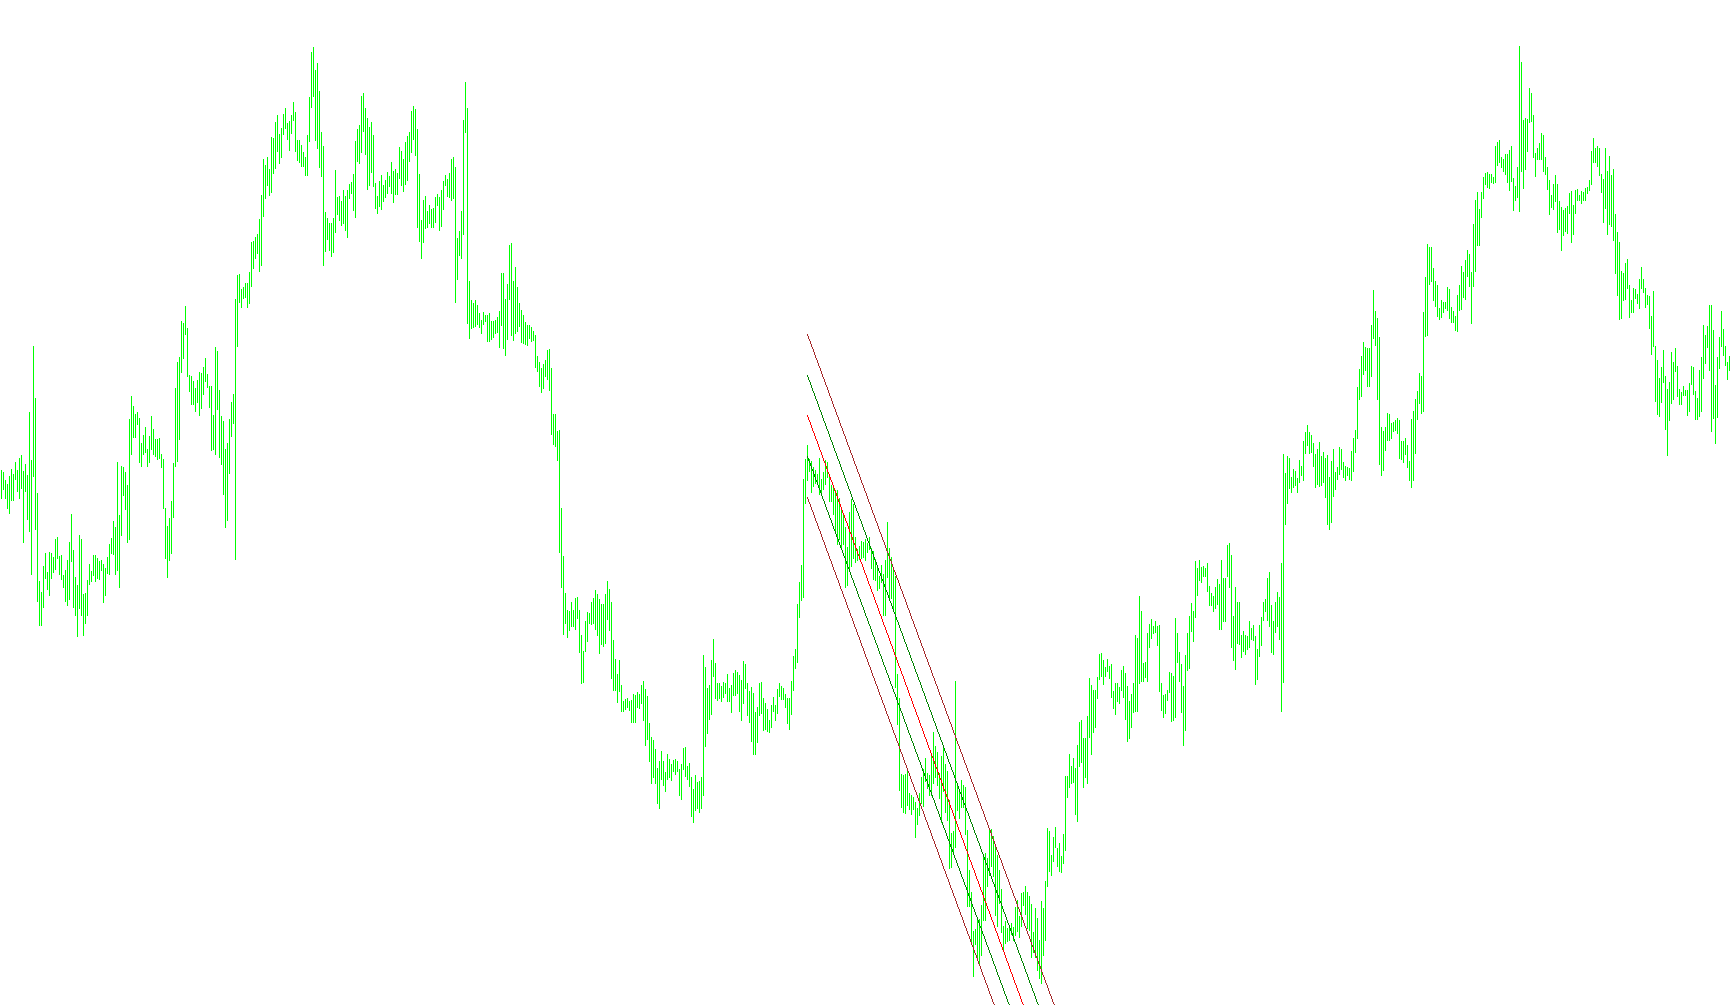
This script is designed to automatically draw a Regression Channel on your trading chart. Unlike standard indicators that simply follow price action, this tool uses mathematical regression to identify the "fair value" trend and the volatility boundaries surrounding it.
Here is a breakdown of how the logic works in plain English:
1. Identifying the Trend Range
The script first scans historical price data to find a specific section of the market to analyze. It does this by looking for significant "breaks" where the price moves significantly away from a Moving Average (the baseline).
Instead of just picking a random amount of time, it identifies the start and end points of a specific price movement. It searches for:
- The lowest point where price dipped significantly below a certain threshold.
- The highest point where price pushed significantly above that same threshold.
These two points define the "boundaries" of the channel. The script then calculates the duration between these two events to determine how long the regression analysis should cover.
2. Calculating the Center Line (The Regression)
Once the start and end points are identified, the script performs a linear regression calculation. Think of this as drawing the "best fit" line through the data.
- It looks at all the high or low prices (depending on the direction of the trend) within that period.
- It calculates a mathematical path that minimizes the distance between the line and the actual price points.
- This results in a Middle Line, which represents the core trend of that specific market move.
3. Determining Volatility (Standard Deviation)
To create the "channel" effect, the script needs to know how much the price typically fluctuates around that center line. It calculates the Standard Deviation, which is a measure of price volatility.
- It measures how far prices usually stray from the middle line during the identified period.
- This measurement is used to project the width of the channel boundaries.
4. Drawing the Channel Boundaries
Finally, the script draws five distinct lines on your chart based on these calculations:
- The Middle Line: The primary trend path.
- The "Inside" Channels: These are drawn using a smaller multiplier (set by the "Standard Deviation Inside" parameter). These represent the "normal" trading zone where price is expected to stay most of the time.
- The "Outside" Channels: These are drawn using a larger multiplier (set by the "Standard Deviation Outside" parameter). These represent extreme volatility zones; when the price touches or breaks these lines, it may indicate a significant overextended move or a potential trend reversal.
Summary for the User
In short, this script automates the process of finding a meaningful historical trend and drawing a mathematical "tunnel" around it. It helps traders visualize the core path of price movement while providing clear visual boundaries to help identify when the market is behaving normally versus when it is reaching extreme levels.
//+------------------------------------------------------------------+
//|                                           Regression_Channel.mq4 |
//|                                        Converted to MT4 by KimIV |
//| Modified bt MrPip to place lines at 2 different Standard Devs    |
//| Also makes StDev level an input                                  |
//+------------------------------------------------------------------+
/*[[
	Name := Regression_Channel
	Author := Copyright © 2004, MetaQuotes Software Corp.
	Link := http://www.metaquotes.net/
]]*/
#property copyright "KimIV"
#property link      "http://www.kimiv.ru"

#property indicator_chart_window

//------- Âíåøíèå ïàðàìåòðû èíäèêàòîðà -------------------------------
extern int    NumberName   = 1;
extern int    iPeriod      = 56;
extern double MAShoot      = 50;
extern int    LineWeight   = 1;
extern color LineColor = Red;
extern double StDevOutside = 1.618;
extern color Outside = Brown;
extern double StDevInside = 0.809;
extern color Inside = Green;


//+------------------------------------------------------------------+
//| Custom indicator initialization function                         |
//+------------------------------------------------------------------+
void init() {
  ObjectCreate("Regression_middle"+NumberName, OBJ_TREND, 0, 0,0, 0,0);
	ObjectSet("Regression_middle"+NumberName, OBJPROP_COLOR, LineColor);
 	ObjectSet("Regression_middle"+NumberName, OBJPROP_STYLE, STYLE_SOLID);
 	ObjectSet("Regression_middle"+NumberName, OBJPROP_WIDTH, LineWeight);
  ObjectCreate("Regression_Outside_upper" +NumberName, OBJ_TREND, 0, 0,0, 0,0);
	ObjectSet("Regression_Outside_upper"+NumberName, OBJPROP_COLOR, Outside);
 	ObjectSet("Regression_Outside_upper"+NumberName, OBJPROP_STYLE, STYLE_SOLID);
 	ObjectSet("Regression_Outside_upper"+NumberName, OBJPROP_WIDTH, LineWeight);
  ObjectCreate("Regression_Outside_lower" +NumberName, OBJ_TREND, 0, 0,0, 0,0);
 	ObjectSet("Regression_Outside_lower"+NumberName, OBJPROP_COLOR, Outside);
 	ObjectSet("Regression_Outside_lower"+NumberName, OBJPROP_STYLE, STYLE_SOLID);
 	ObjectSet("Regression_Outside_lower"+NumberName, OBJPROP_WIDTH, LineWeight);
  ObjectCreate("Regression_Inside_upper" +NumberName, OBJ_TREND, 0, 0,0, 0,0);
	ObjectSet("Regression_Inside_upper"+NumberName, OBJPROP_COLOR, Inside);
 	ObjectSet("Regression_Inside_upper"+NumberName, OBJPROP_STYLE, STYLE_SOLID);
 	ObjectSet("Regression_Inside_upper"+NumberName, OBJPROP_WIDTH, LineWeight);
  ObjectCreate("Regression_Inside_lower" +NumberName, OBJ_TREND, 0, 0,0, 0,0);
 	ObjectSet("Regression_Inside_lower"+NumberName, OBJPROP_COLOR, Inside);
 	ObjectSet("Regression_Inside_lower"+NumberName, OBJPROP_STYLE, STYLE_SOLID);
 	ObjectSet("Regression_Inside_lower"+NumberName, OBJPROP_WIDTH, LineWeight);

  Comment("Auto Regression channel");
}

//+------------------------------------------------------------------+
//| Custor indicator deinitialization function                       |
//+------------------------------------------------------------------+
void deinit() {
  ObjectDelete("Regression_middle"+NumberName);
  ObjectDelete("Regression_Outside_upper" +NumberName);
  ObjectDelete("Regression_Outside_lower" +NumberName);
  ObjectDelete("Regression_Inside_upper" +NumberName);
  ObjectDelete("Regression_Inside_lower" +NumberName);
  Comment("");
}

//+------------------------------------------------------------------+
//| Custom indicator iteration function                              |
//+------------------------------------------------------------------+
void start() {
  bool   check_low, check_high;
  bool   check_upper_chanel;
  double save_low, save_high;
  double MA, a1, a2, a3, b1, a_, b_, y1, y2, price;
  double stddiv_low, stddiv_high, tmp_div;
  double x_n_upOut, x_1_upOut, x_n_downOut, x_1_downOut;
  double x_n_upIn, x_1_upIn, x_n_downIn, x_1_downIn;
  double ratio_currency;
  int     shift;
  int    n, n_begin, n_end;
  int    MAType, MAPrice;
  int    save_shift_low, save_shift_high;

  save_low = -1;
  save_high = -1;
  save_shift_low = -1;
  save_shift_high = -1;

  check_low = false;
  check_high = false;

  MAType = MODE_SMA;
  MAPrice = PRICE_CLOSE;

  if (Close[1]>80) ratio_currency = 100;
  else ratio_currency = 10000;

  // Ïîèñê òî÷åê ïåðåñå÷åíèÿ ñ ÌÀ
  for (shift=Bars-1; shift>=0; shift--) {
  	MA = iMA(NULL, 0, iPeriod, 0, MAType, MAPrice, shift);
  	if (MA-MAShoot/ratio_currency>Close[shift])	{
  		if (Close[shift]<save_low || save_low==-1) {
  			check_low = true;
  			save_low = Close[shift];
  			save_shift_low = shift;
  		}
  	}

  	if (MA+MAShoot/ratio_currency<Close[shift]) {
  		if (save_high<Close[shift] || save_high==-1) {
  			check_high = true;
  			save_high = Close[shift];
  			save_shift_high = shift;
  		}
  	}

  	if (check_low) {
  		if (MA+MAShoot/ratio_currency<Close[shift])	{
  			check_low = false;
  			save_low = -1;
  		}
  	}

  	if (check_high) {
  		if (MA-MAShoot/ratio_currency>Close[shift]) {
  			check_high = false;
  			save_high = -1;
  		}
  	}
  }

  //Îïðåäåëåíèå ãðàíèö ïîñòðîåíèÿ êàíàëëà
  if (save_shift_low>save_shift_high) {
  	n_begin = save_shift_low;
  	n_end = save_shift_high;
  } else {
  	n_begin = save_shift_high;
  	n_end = save_shift_low;
  }

  if (n_end==0) n_end = 1; // Íóëåâîé áàð íå èñïîëüçîâàòü
  n = n_begin - n_end + 1; // äëèíà êàíàëà

  a1 = 0;
  a2 = 0;
  a3 = 0;
  b1 = 0;
  a_ = 0;
  b_ = 0;
  y1 = 0;
  y2 = 0;
  tmp_div = 0;

  if (Close[n_begin]<Close[n_end]) check_upper_chanel = true;
  else check_upper_chanel = false;

  for (shift=n_begin; shift>=n_end; shift--) {
  	if (check_upper_chanel) price = Low[shift];
  	else price = High[shift];

  	a1 = a1 + shift*price;
  	a2 = a2 + shift;
  	a3 = a3 + price;
  	b1 = b1 + shift*shift;
  }

  b_ = (n*a1 - a2*a3)/(n*b1 - a2*a2);
  a_ = (a3 - b_*a2)/n;
  y1 = a_ + b_*n_begin;
  y2 = a_ + b_*n_end;

 	ObjectSet("Regression_middle"+NumberName, OBJPROP_TIME1, Time[n_begin]);
 	ObjectSet("Regression_middle"+NumberName, OBJPROP_TIME2, Time[n_end]);
 	ObjectSet("Regression_middle"+NumberName, OBJPROP_PRICE1, y1);
 	ObjectSet("Regression_middle"+NumberName, OBJPROP_PRICE2, y2);

  for (shift=n_begin; shift>=n_end; shift--) {
  	if (check_upper_chanel) price = Low[shift];
	  else price = High[shift];

  	tmp_div = tmp_div + (price - (a_ + b_*shift))*(price - (a_ + b_*shift));
  }

  stddiv_low = MathSqrt(tmp_div/n);
  stddiv_high = MathSqrt(tmp_div/n);

  x_n_upOut = y1 + StDevOutside*stddiv_high;
  x_1_upOut = y2 + StDevOutside*stddiv_high;

  x_n_downOut = y1 - StDevOutside*stddiv_low;
  x_1_downOut = y2 - StDevOutside*stddiv_low;

  x_n_upIn = y1 + StDevInside*stddiv_high;
  x_1_upIn = y2 + StDevInside*stddiv_high;

  x_n_downIn = y1 - StDevInside*stddiv_low;
  x_1_downIn = y2 - StDevInside*stddiv_low;


//OUTSIDE
  //upper
 	ObjectSet("Regression_Outside_upper"+NumberName, OBJPROP_TIME1, Time[n_begin]);
 	ObjectSet("Regression_Outside_upper"+NumberName, OBJPROP_TIME2, Time[n_end]);
 	ObjectSet("Regression_Outside_upper"+NumberName, OBJPROP_PRICE1, x_n_upOut);
 	ObjectSet("Regression_Outside_upper"+NumberName, OBJPROP_PRICE2, x_1_upOut);
  //lower
 	ObjectSet("Regression_Outside_lower"+NumberName, OBJPROP_TIME1, Time[n_begin]);
 	ObjectSet("Regression_Outside_lower"+NumberName, OBJPROP_TIME2, Time[n_end]);
 	ObjectSet("Regression_Outside_lower"+NumberName, OBJPROP_PRICE1, x_n_downOut);
 	ObjectSet("Regression_Outside_lower"+NumberName, OBJPROP_PRICE2, x_1_downOut);

//INSIDE
  //upper
 	ObjectSet("Regression_Inside_upper"+NumberName, OBJPROP_TIME1, Time[n_begin]);
 	ObjectSet("Regression_Inside_upper"+NumberName, OBJPROP_TIME2, Time[n_end]);
 	ObjectSet("Regression_Inside_upper"+NumberName, OBJPROP_PRICE1, x_n_upIn);
 	ObjectSet("Regression_Inside_upper"+NumberName, OBJPROP_PRICE2, x_1_upIn);
  //lower
 	ObjectSet("Regression_Inside_lower"+NumberName, OBJPROP_TIME1, Time[n_begin]);
 	ObjectSet("Regression_Inside_lower"+NumberName, OBJPROP_TIME2, Time[n_end]);
 	ObjectSet("Regression_Inside_lower"+NumberName, OBJPROP_PRICE1, x_n_downIn);
 	ObjectSet("Regression_Inside_lower"+NumberName, OBJPROP_PRICE2, x_1_downIn);

}
//-------------------------------------------------------------------+
Comments