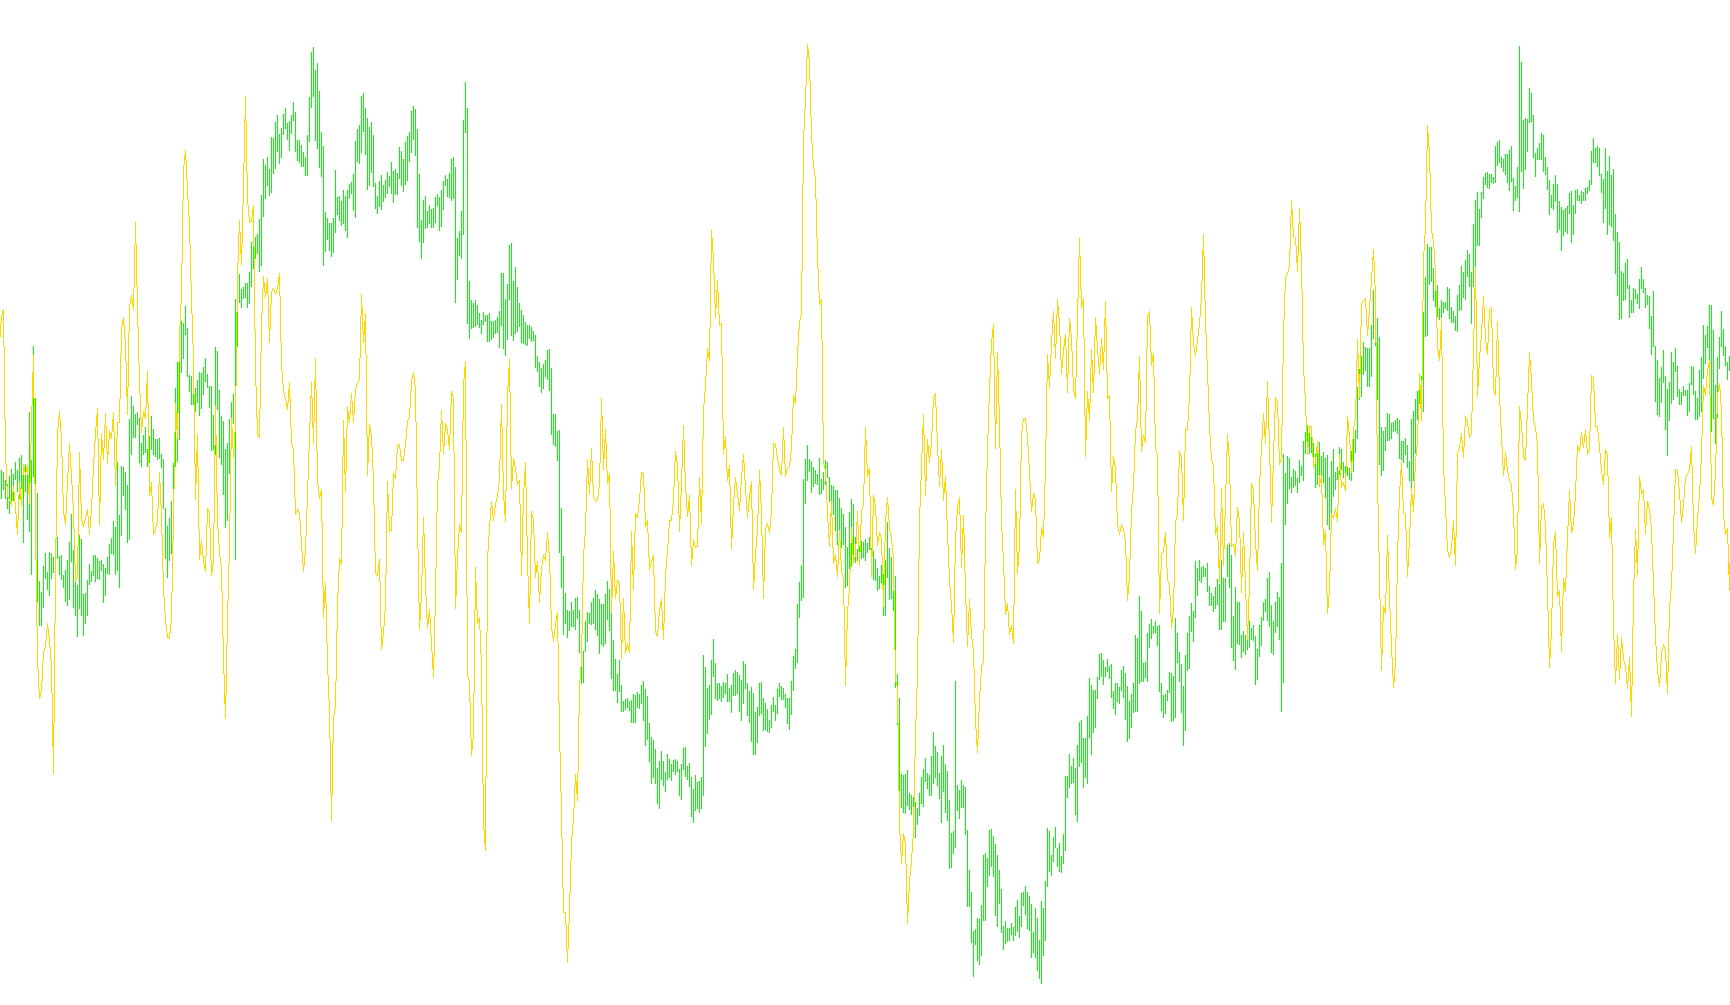
This tool is designed to measure the speed and velocity of price movements on a financial chart. Rather than looking at just the current price, it analyzes how much the price has changed over a specific period of time.
Core Functionality
The primary purpose of this script is to calculate the Rate of Change (ROC). It identifies the difference between the current closing price and the closing price from a set number of candles ago (defined by the user). By visualizing this difference, it helps traders understand whether a trend is accelerating, slowing down, or reversing.
Key Features and Logic
- Customizable Timeframe: You can define the specific look-back period. For example, if you set the period to 10, the tool compares today's price against the price from 10 intervals ago to determine the momentum.
- Two Modes of Measurement: The script offers flexibility in how the data is presented:
- Standard Mode: This shows the raw numerical difference between the two prices. It tells you exactly how many points or pips the price has moved.
- Percentage Mode: When enabled, the tool converts that raw movement into a percentage. This is particularly useful for comparing different assets (like comparing a high-priced stock to a low-priced currency) because it provides a standardized relative growth figure.
- Visual Representation: The results are plotted as a continuous line in a separate window below your main chart. This allows you to see the "rhythm" of the market movements without cluttering the actual price candles.
How It Assists the User
By monitoring this indicator, you can identify significant shifts in market momentum. When the line moves sharply upward or downward, it signals that the price is moving rapidly. Conversely, a flattening line suggests that the current trend is losing steam, which may indicate that a price consolidation or a potential reversal is approaching.
//+------------------------------------------------------------------+
//|                                                          ROC.mq4 |
//|                                    Copyright © 2006, Robert Hill |
//+------------------------------------------------------------------+

#property  copyright "Copyright © 2006, Robert Hill"
//---- indicator settings
#property  indicator_separate_window
#property  indicator_buffers 1
#property  indicator_color1  Red
//---- indicator parameters
extern int RPeriod = 10;
extern bool UsePercent = false;
//---- indicator buffers
double RateOfChange[];
//+------------------------------------------------------------------+
//| Custom indicator initialization function                         |
//+------------------------------------------------------------------+
int init()
  {
//---- drawing settings
   SetIndexStyle(0, DRAW_LINE);
   SetIndexDrawBegin(0, RPeriod);
   IndicatorDigits(Digits + 1);
//---- indicator buffers mapping
   if(!SetIndexBuffer(0, RateOfChange))
       Print("cannot set indicator buffers!");
//---- name for DataWindow and indicator subwindow label
   IndicatorShortName("ROC(" + RPeriod + ")");
//---- initialization done
   return(0);
  }
//+------------------------------------------------------------------+
//| Moving Averages Convergence/Divergence                           |
//+------------------------------------------------------------------+
int start()
  {
   int limit;
   double ROC, CurrentClose, PrevClose;
   int counted_bars = IndicatorCounted();
//---- check for possible errors
   if(counted_bars < 0)
       return(-1);
//---- last counted bar will be recounted
   if(counted_bars > 0)
       counted_bars--;
   limit = Bars - counted_bars - RPeriod;
//---- ROC calculation
   for(int i = 0; i < limit; i++)
     {
       CurrentClose = iClose(NULL, 0, i);
       PrevClose = iClose(NULL, 0, i + RPeriod);
       ROC = CurrentClose - PrevClose;
       //----
       if(UsePercent)
         {
           if(PrevClose != 0)
               RateOfChange[i] = 100 * ROC / PrevClose;
         }
       else
           RateOfChange[i] = ROC;
     }
//---- done
   return(0);
  }
//+------------------------------------------------------------------+
Comments