RFTL_v1
Download script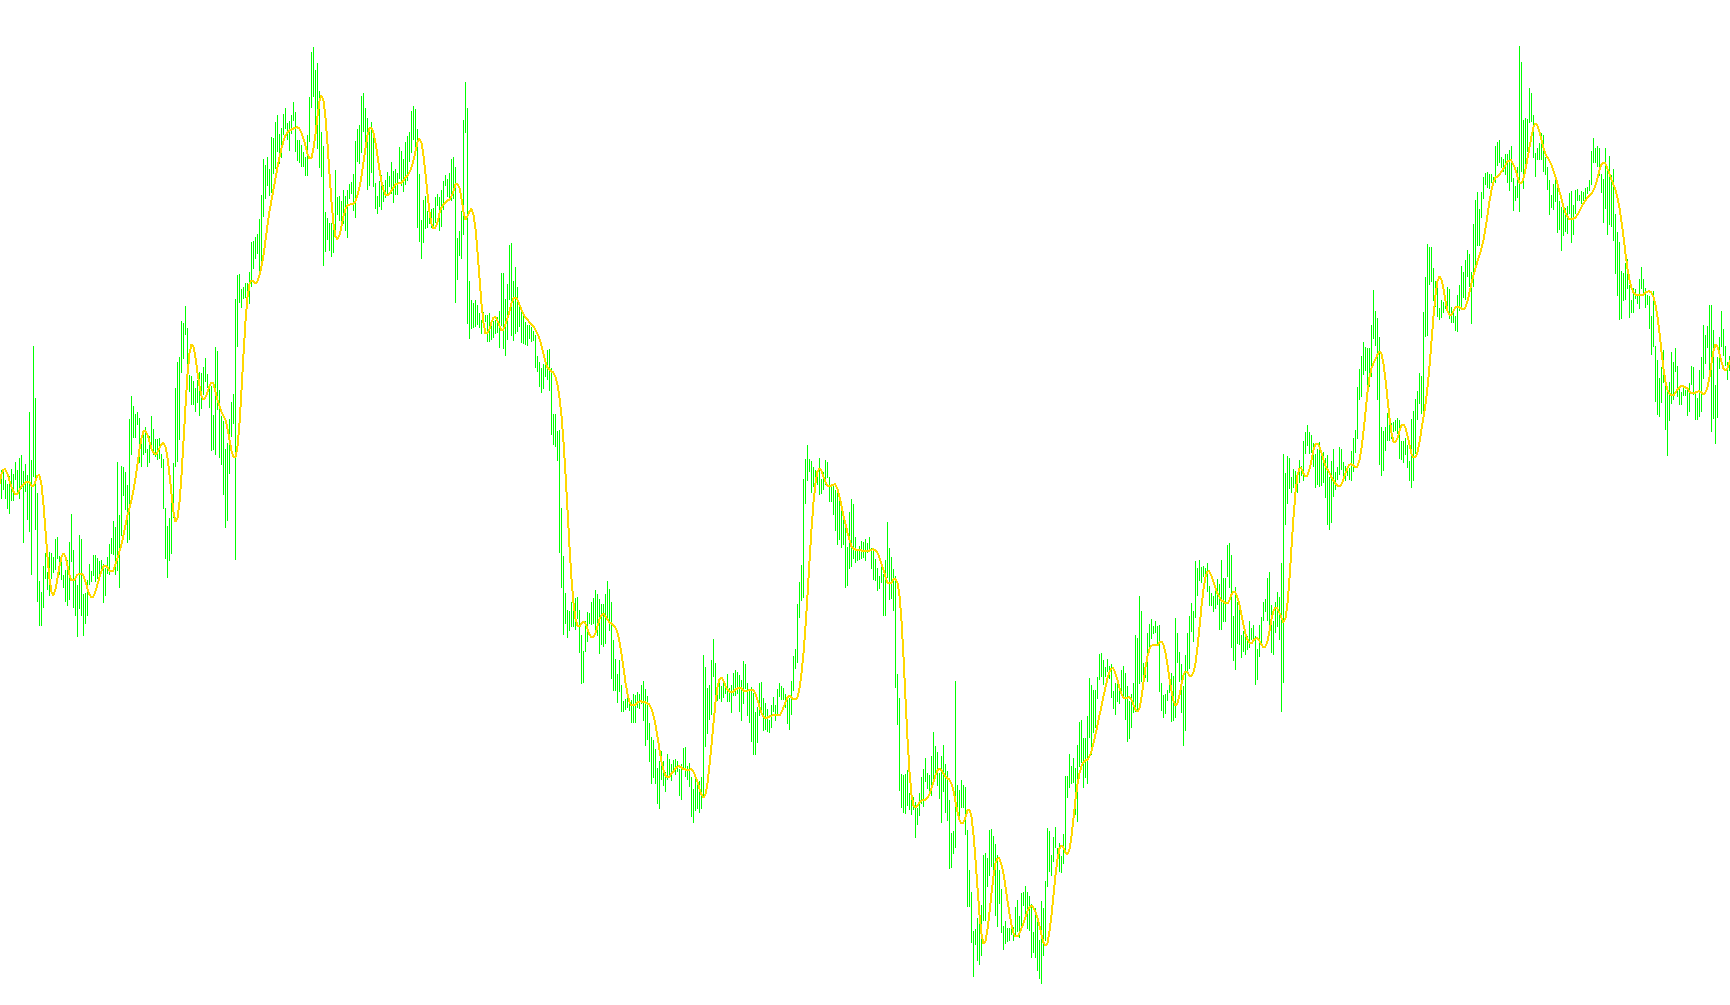
This tool is a specialized technical analysis indicator designed to help traders identify trends and price movements by smoothing out market "noise." Instead of simply looking at the most recent price action, it uses a mathematically weighted approach to provide a clearer picture of where the market is heading.
How It Works
The core logic of this script revolves around a Weighted Moving Average. Unlike a standard moving average—where every day or hour in a period might be treated with equal importance—this indicator assigns a specific "weight" (a coefficient) to 44 different historical data points.
Key components of its logic include:
- Historical Data Processing: The script looks back at the last 44 closing prices on your chart.
- Weight Distribution: Each of those 44 price points is multiplied by a unique numerical value provided in the underlying formula. Some points are given more importance (higher positive or negative values), while others are given less weight. This creates a balanced curve that reacts to significant price shifts while ignoring minor, erratic fluctuations.
- The Calculation: The indicator adds all these weighted values together to produce a single resulting point. By repeating this process across the chart, it generates a continuous line.
What This Means for You
When you view the resulting line on your chart, you are seeing a "filtered" version of price action. Because it uses 44 distinct periods with specific weights, it is designed to:
- Identify Trends: The line helps visualize the underlying direction of the market more clearly than raw price candles alone.
- Reduce Market Noise: By averaging out the data using these specific coefficients, the indicator helps filter out the "jitter" of the market, making it easier to see the broader movement.
- Provide Smooth Visuals: The final output is a solid line that represents a calculated equilibrium of the price over the defined period, allowing for more stable visual analysis of your trading pairs.
//+------------------------------------------------------------------+
//|                                                         RFTL.mq4 |
//|                            Copyright 2005, Gordago Software Ltd. |
//|                                          http://www.gordago.com/ |
//+------------------------------------------------------------------+
#property copyright "Copyright 2005, Gordago Software Ltd."
#property link      "http://www.gordago.com"

#property indicator_chart_window
#property indicator_buffers 1
#property indicator_color1 Aquamarine

double RFTLBuffer[];

#define RFTLPeriods 44

double g_RFTLKoef[RFTLPeriods]=
 {-0.0025097319, +0.0513007762 , +0.1142800493 , +0.1699342860 , +0.2025269304 ,
  +0.2025269304, +0.1699342860 , +0.1142800493 , +0.0513007762 , -0.0025097319 ,
  -0.0353166244, -0.0433375629 , -0.0311244617 , -0.0088618137 , +0.0120580088 ,
  +0.0233183633, +0.0221931304 , +0.0115769653 , -0.0022157966 , -0.0126536111 ,
  -0.0157416029, -0.0113395830 , -0.0025905610 , +0.0059521459 , +0.0105212252 ,
  +0.0096970755, +0.0046585685 , -0.0017079230 , -0.0063513565 , -0.0074539350 ,
  -0.0050439973, -0.0007459678 , +0.0032271474 , +0.0051357867 , +0.0044454862 ,
  +0.0018784961, -0.0011065767 , -0.0031162862 , -0.0033443253 , -0.0022163335 ,
  +0.0002573669, +0.0003650790 , +0.0060440751 , +0.0018747783 };

int init()
  {
   IndicatorBuffers(1);

   SetIndexStyle(0,DRAW_LINE,STYLE_SOLID,2);
   SetIndexBuffer(0, RFTLBuffer);
   SetIndexDrawBegin(0,44);

   return(0);
  }
int deinit()
  {
   return(0);
  }
int start()
{
   int    counted_bars=IndicatorCounted();
   int    j,pos;
   double sum2;
   if(counted_bars<0)  return(-1);

   for (pos=Bars-counted_bars-1;pos>=0;pos--)
     {
	   sum2=0;          // zero summary
      for(j=0;j<RFTLPeriods;j++) sum2+=g_RFTLKoef[j]*Close[pos+j];//Counted RFTL[pos]
	   RFTLBuffer[pos]=sum2;
     }
   return(0);
}
Comments