ROC
Download script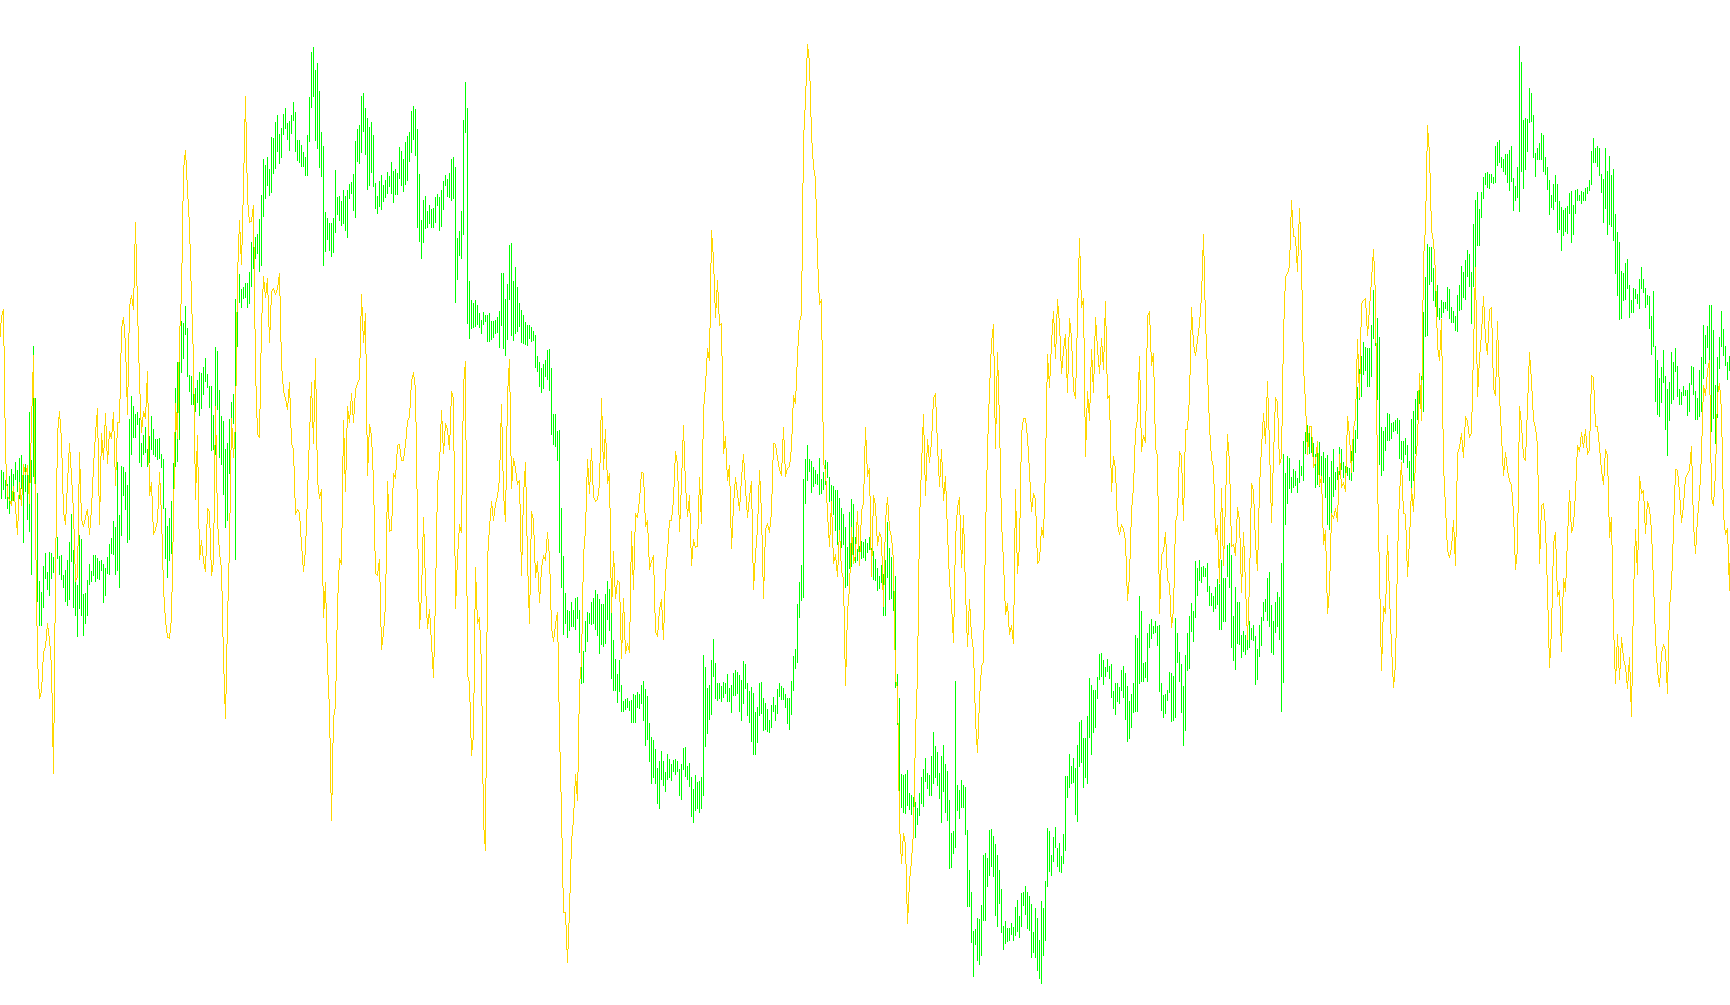
This custom technical indicator is designed to help traders visualize the momentum and price velocity of a financial asset. Instead of looking at complex moving averages, this tool focuses on the specific "Rate of Change" (ROC) over a defined period, providing a clearer picture of how quickly prices are moving in a given direction.
How the Logic Works
The Core Calculation The script examines the current price of an asset and compares it to the price from a set number of candles or bars in the past (defined by a user-adjustable period). By subtracting the old price from the current price, the indicator determines the raw distance the market has traveled.
Customizable Viewing Options The logic offers two distinct ways to visualize this data depending on the trader's preference:
- Standard Mode: The indicator displays the absolute difference between the two prices. This is useful for seeing the direct numerical change in value.
- Percentage Mode: When enabled, the script converts that raw distance into a percentage. This is highly effective for comparing different assets (like stocks vs. currencies) because it allows you to see the relative speed of growth regardless of the asset's total price.
Visual Representation The result is plotted as a red line in a separate window below the main price chart. As the line moves up, it signifies that the price is increasing at a specific rate; as it moves down, it indicates a decrease. This allows traders to identify trends, shifts in momentum, and potential exhaustion points in the market movement more efficiently than by watching the raw price alone.
/*-----------------------------+
|			       |
| Shared by www.Aptrafx.com    |
|			       |
+------------------------------*/

//+------------------------------------------------------------------+
//|                                                  Custom MACD.mq4 |
//|                      Copyright © 2004, MetaQuotes Software Corp. |
//|                                       http://www.metaquotes.net/ |
//+------------------------------------------------------------------+
#property  copyright "Copyright © 2004, MetaQuotes Software Corp."
#property  link      "http://www.metaquotes.net/"
//---- indicator settings
#property  indicator_separate_window
#property  indicator_buffers 1
#property  indicator_color1  Red
//---- indicator parameters
extern int RPeriod=10;
extern bool UsePercent = false;

//---- indicator buffers
double     RateOfChange[];

//+------------------------------------------------------------------+
//| Custom indicator initialization function                         |
//+------------------------------------------------------------------+
int init()
  {
//---- drawing settings
   SetIndexStyle(0,DRAW_LINE);
   SetIndexDrawBegin(0,RPeriod);
   IndicatorDigits(MarketInfo(Symbol(),MODE_DIGITS)+1);
//---- indicator buffers mapping
   if(!SetIndexBuffer(0,RateOfChange))
      Print("cannot set indicator buffers!");
//---- name for DataWindow and indicator subwindow label
   IndicatorShortName("ROC("+RPeriod+")");
   SetIndexLabel(0,"ROC");
//---- initialization done
   return(0);
  }
//+------------------------------------------------------------------+
//| Moving Averages Convergence/Divergence                           |
//+------------------------------------------------------------------+
int start()
  {
   int limit;
   double ROC, CurrentClose, PrevClose;
   int counted_bars=IndicatorCounted();
//---- check for possible errors
   if(counted_bars<0) return(-1);
//---- last counted bar will be recounted
   if(counted_bars>0) counted_bars--;
   limit=Bars-counted_bars;
//---- ROC calculation
   for(int i=0; i<limit; i++)
   {
      CurrentClose = iClose(NULL,0,i);
      PrevClose = iClose(NULL,0,i+RPeriod);
      ROC=CurrentClose-PrevClose;
      if (UsePercent)
      {
        RateOfChange[i] = 100 * ROC / PrevClose;
      }
      else
      {
        RateOfChange[i] = ROC;
      }
   }

//---- done
   return(0);
  }
Comments