ROC1
Download script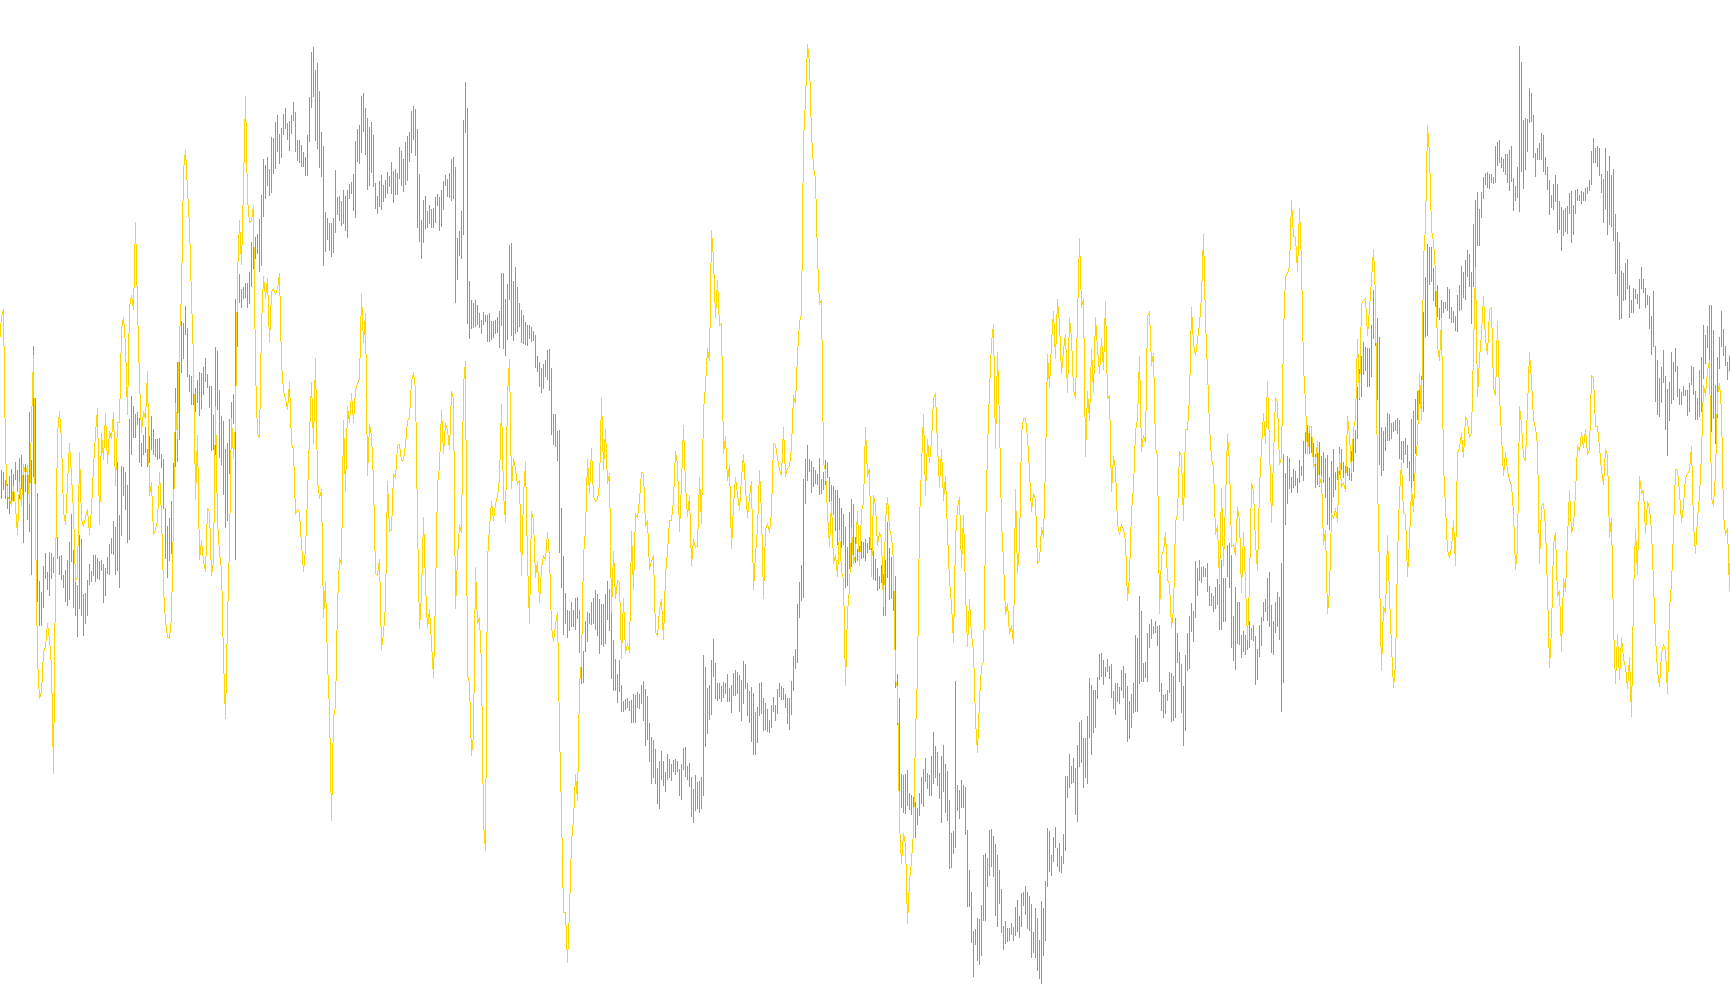
This tool is designed to measure the speed at which a financial asset's price is changing over a specific period. In simpler terms, it helps traders understand whether the price is accelerating upward, slowing down, or dropping rapidly by looking at the difference between the current price and the price from a set number of bars ago.
How the Logic Works
The indicator operates based on three primary components:
1. The Lookback Period The user can define a specific timeframe (the "RPeriod") to analyze. This tells the script how far back in history it needs to look to find a comparison point. For example, if the period is set to 10, the tool compares the current price against the price from exactly 10 bars ago.
2. The Difference Calculation The core logic follows a straightforward subtraction process:
- It identifies the Current Price.
- It identifies the Past Price (based on the lookback period).
- It subtracts the Past Price from the Current Price to determine the total "Raw Change."
3. Data Visualization Options The script offers two different ways to display this information depending on your trading preference:
- Standard Mode: This shows the raw numerical difference between the two prices. It tells you exactly how many units or pips the price has moved over the chosen period.
- Percentage Mode: If enabled, the script converts that raw difference into a percentage. This is often preferred by traders because it allows for an "apples-to-apples" comparison between different assets (like comparing the volatility of a currency pair versus a stock) regardless of their actual price values.
Visual Representation
The resulting data is plotted as a line in a separate window below your main trading chart. By observing the direction and steepness of this line, you can quickly gauge the momentum of the market:
- A rising line indicates positive momentum (price is increasing).
- A falling line indicates negative momentum (price is decreasing).
- The steeper the line, the faster the price change is occurring.
/*-----------------------------+
|			       |
| Shared by www.Aptrafx.com    |
|			       |
+------------------------------*/

//+------------------------------------------------------------------+
//|                                                          ROC.mq4 |
//|                                    Copyright © 2006, Robert Hill |
//|                                                                  |
//+------------------------------------------------------------------+
#property  copyright "Copyright © 2006, Robert Hill"
//---- indicator settings
#property  indicator_separate_window
#property  indicator_buffers 1
#property  indicator_color1  Red
//---- indicator parameters
extern int RPeriod=10;
extern bool UsePercent = false;

//---- indicator buffers
double     RateOfChange[];

//+------------------------------------------------------------------+
//| Custom indicator initialization function                         |
//+------------------------------------------------------------------+
int init()
  {
//---- drawing settings
   SetIndexStyle(0,DRAW_LINE);
   SetIndexDrawBegin(0,RPeriod);
   IndicatorDigits(MarketInfo(Symbol(),MODE_DIGITS)+1);
//---- indicator buffers mapping
   if(!SetIndexBuffer(0,RateOfChange))
      Print("cannot set indicator buffers!");
//---- name for DataWindow and indicator subwindow label
   IndicatorShortName("ROC("+RPeriod+")");
   SetIndexLabel(0,"ROC");
//---- initialization done
   return(0);
  }
//+------------------------------------------------------------------+
//| Moving Averages Convergence/Divergence                           |
//+------------------------------------------------------------------+
int start()
  {
   int limit;
   double ROC, CurrentClose, PrevClose;
   int counted_bars=IndicatorCounted();
//---- check for possible errors
   if(counted_bars<0) return(-1);
//---- last counted bar will be recounted
   if(counted_bars>0) counted_bars--;
   limit=Bars-counted_bars;
//---- ROC calculation
   for(int i=0; i<limit; i++)
   {
      CurrentClose = iClose(NULL,0,i);
      PrevClose = iClose(NULL,0,i+RPeriod);
      ROC=CurrentClose-PrevClose;
      if (UsePercent)
      {
        RateOfChange[i] = 100 * ROC / PrevClose;
      }
      else
      {
        RateOfChange[i] = ROC;
      }
   }

//---- done
   return(0);
  }
Comments