Robby DSS Bressert Colored with alert v1.1
Download script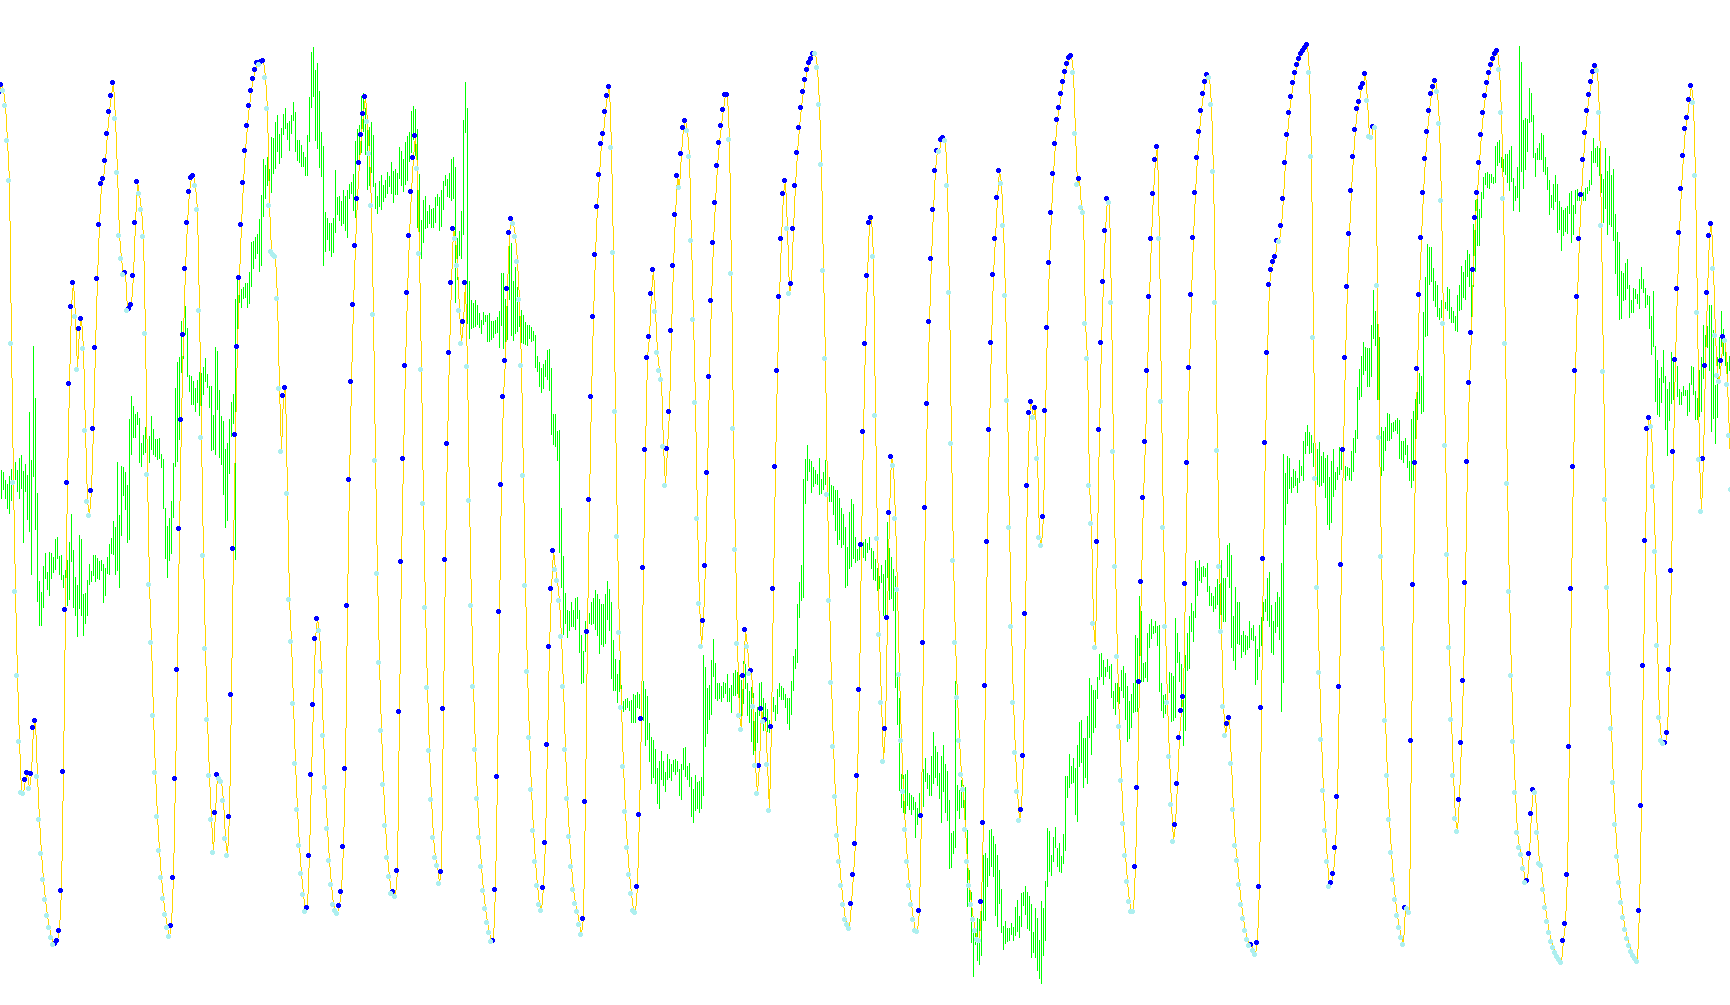
This script functions as a momentum and trend-following indicator designed to help traders visualize the relative strength and direction of price movements. It processes market data through a multi-layered calculation to filter out "noise" and provide clearer signals on whether the current trend is moving upward or downward.
Core Logic and Workflow
The indicator operates by transforming raw price data into a smoothed percentage value through three distinct phases:
1. Initial Momentum Calculation (MIT) The tool first looks at a specific window of recent price history to identify the highest highs and lowest lows. It then calculates where the current closing price sits within that range as a percentage. This gives the tool a raw sense of "where we are" relative to recent extremes.
2. Primary Smoothing Layer To prevent the data from jumping around too erratically, the script applies a smoothing technique (similar to an Exponential Moving Average). It takes the momentum calculated in the first step and blends it with previous values. This creates a more fluid, "curved" line that highlights the underlying trend rather than every tiny price tick.
3. Secondary DSS Calculation The logic then performs a second calculation on the already smoothed data. By calculating the relative position of the smooth line against its own recent highs and lows, it produces the final DSS (Dynamic Stochastic Strength) value. This double-processing serves to further refine the trend, ensuring that the visual output represents stable market momentum.
Visual Indicators and Alerts
The script translates these complex calculations into three visual components on your chart:
- The Trend Line: A continuous line represents the overall DSS value, allowing you to see the general flow of the market strength.
- Up and Down Markers: The script monitors the direction of the DSS line from one candle to the next. When the line shifts upward, it identifies an "Up" signal; when it shifts downward, it identifies a "Down" signal. These are represented by specific markers on the chart to highlight immediate changes in momentum.
- Real-Time Alerts: If enabled, the tool acts as an active monitoring system. It scans for the exact moment the trend flips (e.g., moving from an upward state to a downward state) and triggers a notification. This ensures you are notified of significant shifts in sentiment immediately without having to watch the screen constantly.
Summary of Purpose
Instead of just showing you where the price is, this script tells you how strongly the price is moving in a specific direction. By smoothing the data twice, it aims to provide a cleaner view of the market's "pulse," helping traders identify when a trend is gaining strength or beginning to exhaust.
//+------------------------------------------------------------------+
//|                                   Robby DSS Bressert Colored.mq4 |
//|                                                   Jaanus Jantson |
//|                          http://fx.jantson.ee; jaanus@jantson.ee |
//|                      Copyright © 2008, MetaQuotes Software Corp. |
//|                                       http://www.metaquotes.net/ |
//+------------------------------------------------------------------+
#property copyright "Copyright © 2008, MetaQuotes Software Corp."
#property link      "http://www.metaquotes.net/"

#property indicator_separate_window
#property indicator_minimum 0
#property indicator_maximum 100
#property indicator_buffers 3
#property indicator_color1 OrangeRed
#property indicator_width1 3
#property indicator_color2 Blue
#property indicator_width2 2
#property indicator_color3 Red
#property indicator_width3 2
#property indicator_level1 20
#property indicator_level2 80

extern bool      AlertOn = true;
extern int       EMA_period=8;
extern int       Stochastic_period=13;


double DssBuffer[];
double MitBuffer[];
double DssBuffer_UP[];
double DssBuffer_DW[];


double smooth_coefficient;
datetime alertonce = 0;

int init()
{
   IndicatorBuffers(4);
   SetIndexBuffer(0,DssBuffer);
   SetIndexStyle(0,DRAW_LINE);
   SetIndexBuffer(1,DssBuffer_UP);
   SetIndexStyle(1,DRAW_ARROW);
   SetIndexArrow(1,159);
   SetIndexBuffer(2,DssBuffer_DW);
   SetIndexStyle(2,DRAW_ARROW);
   SetIndexArrow(2,159);

   SetIndexBuffer(3,MitBuffer);

   SetIndexEmptyValue(0, 0.0);
   SetIndexLabel(0, "DSS");
   SetIndexEmptyValue(1, 0.0);
   SetIndexLabel(1, "DSS Up");
   SetIndexEmptyValue(2, 0.0);
   SetIndexLabel(2, "DSS Down");

   IndicatorShortName ("DSS("+EMA_period+","+Stochastic_period+")");

   smooth_coefficient = 2.0 / (1.0 + EMA_period);
   return(0);
}


int start()
{
   int i, limit, counted_bars=IndicatorCounted(), Bar_OK;
   if (counted_bars == 0)   limit = Bars - Stochastic_period;
   if (counted_bars > 0)   limit = Bars - counted_bars;

   double HighRange, LowRange;
   double delta, MIT;
   for (i = limit; i >= 0; i--)
   {
      HighRange = High[iHighest(NULL,0,MODE_HIGH,Stochastic_period,i)];
      LowRange = Low[iLowest(NULL,0,MODE_LOW,Stochastic_period,i)];
      delta = Close[i] - LowRange;
      MIT = delta/(HighRange - LowRange)*100.0;
      MitBuffer[i] = smooth_coefficient * (MIT - MitBuffer[i+1]) + MitBuffer[i+1];
   }

   double DSS;
   for (i = limit; i >= 0; i--)
   {
      HighRange = MitBuffer[ArrayMaximum(MitBuffer, Stochastic_period, i)];
      LowRange = MitBuffer[ArrayMinimum(MitBuffer, Stochastic_period, i)];
      delta = MitBuffer[i] - LowRange;
      DSS = delta/(HighRange - LowRange)*100.0;
      DssBuffer[i] = smooth_coefficient * (DSS - DssBuffer[i+1]) + DssBuffer[i+1];
   }

   for (i = limit; i >= 0; i--)
   {
      //DssBuffer_UP[i]=EMPTY_VALUE;
      //DssBuffer_DW[i]=EMPTY_VALUE;
      Bar_OK=0;

      if(DssBuffer[i]>DssBuffer[i+1])
      {
         DssBuffer_UP[i]=DssBuffer[i];
         Bar_OK=1;
         DssBuffer_DW[i] = 0.0;
      }

      if(DssBuffer[i]<DssBuffer[i+1])
      {
         DssBuffer_DW[i]=DssBuffer[i];
         Bar_OK=1;
         DssBuffer_UP[i] = 0.0;
      }

      if(Bar_OK==0)
      {
         DssBuffer_UP[i]=DssBuffer_UP[i+1];
         DssBuffer_DW[i]=DssBuffer_DW[i+1];
      }
   }

   if ( AlertOn && alertonce != Time[0] )
      {
         if ( DssBuffer_DW[1] != 0.0 && DssBuffer_DW[2] == 0.0 )
            {
               Alert(Symbol(), " DSS DOWN ON ", Period(), "Minute  AT ", Close[0]  );
               alertonce = Time[0];
            }
         if ( DssBuffer_UP[1] != 0.0 && DssBuffer_UP[2] == 0.0 )
            {
               Alert(Symbol(), " DSS UP ON ", Period(), "Minute  AT ", Close[0] );
               alertonce = Time[0];
            }
      }

   return(0);
}
Comments