PCCI
Download script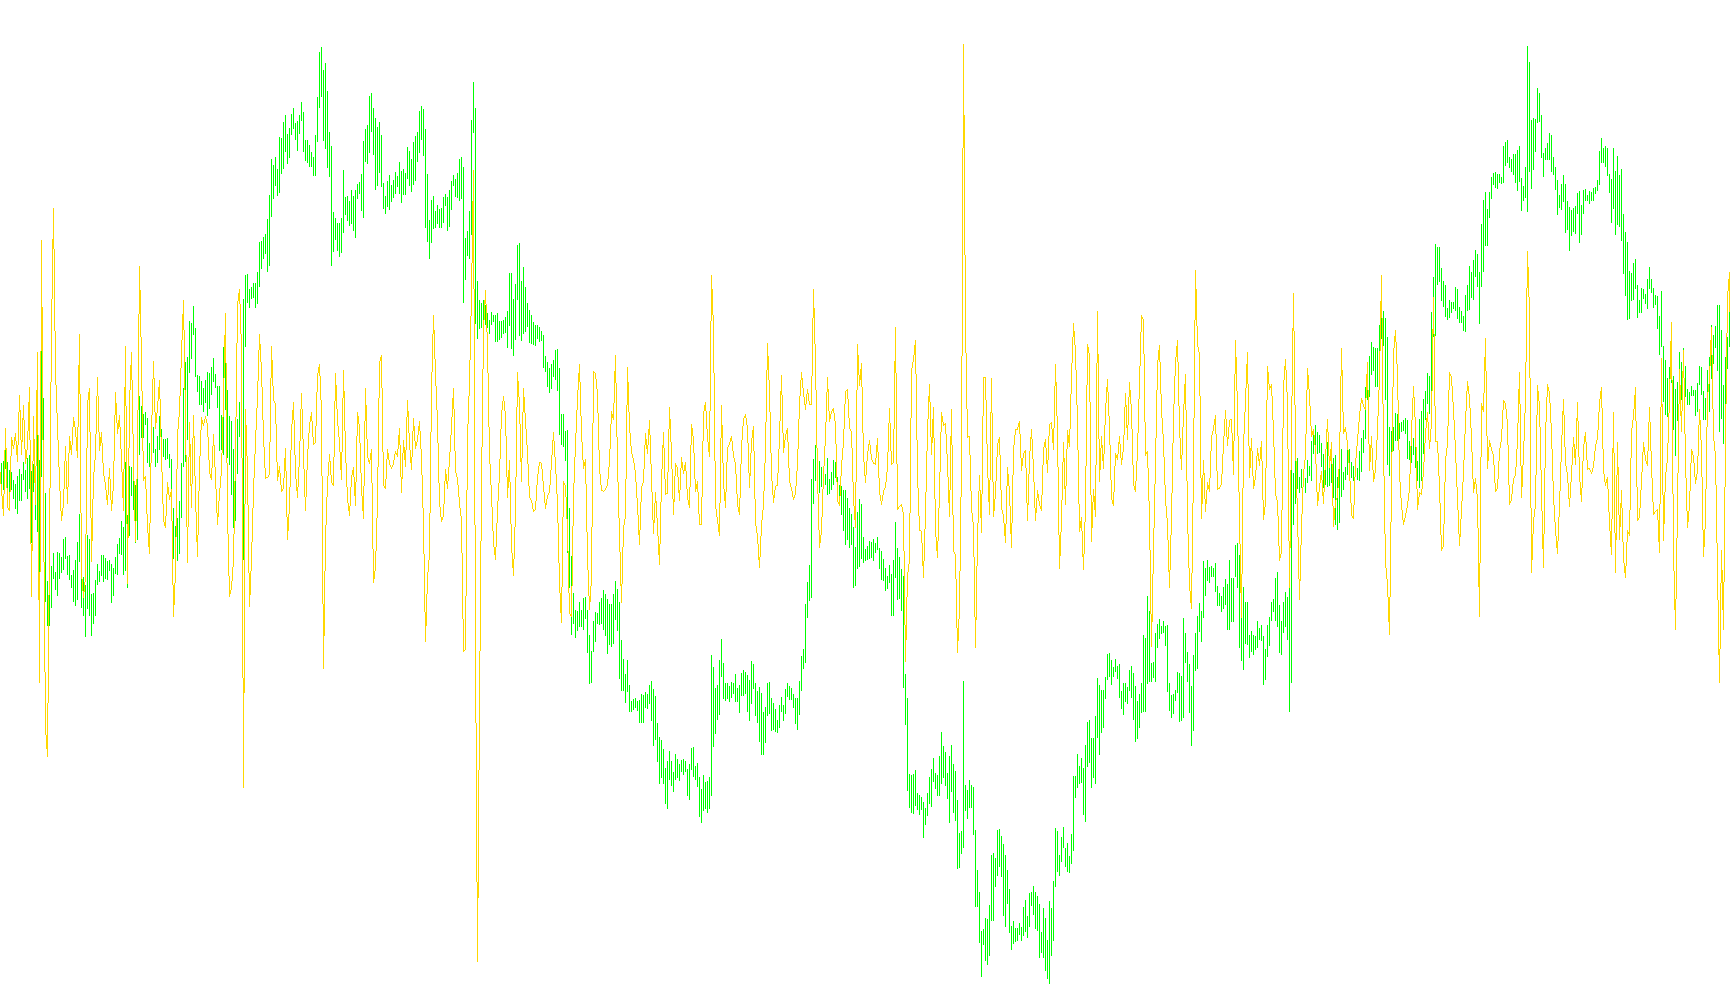
The PCCI (Price oscillators/component indicator) is a specialized technical analysis tool designed to help traders identify market trends and price momentum by analyzing historical data. Unlike standard indicators that might only look at the most recent price action, this script performs a sophisticated "weighted" calculation to smooth out market noise and reveal underlying price movements.
How the Logic Works
1. Multi-Period Data Analysis The indicator looks back at a specific window of historical price data—specifically, it examines the 40 most recent completed candles (price bars) on your chart. By analyzing this range, the tool gains a broader perspective of where the market has been, rather than reacting impulsively to every minor price flicker.
2. Weighted Calculation System The core of the script relies on a complex mathematical formula that assigns a specific "weight" or importance level to each of those 40 historical data points.
- Some recent prices are given higher priority (positive weight).
- Older prices or specific price movements in the middle of the range may be given lower priority or even a negative influence (subtractive weight).
By blending these various historical prices together using these precise coefficients, the indicator creates a customized "average" that reflects the unique momentum of the current market trend.
3. Price Center Offset To translate this complex calculation into a visual format, the script identifies the midpoint of the current candle (the average between the High and Low prices). It then subtracts the calculated weighted value from this midpoint.
What This Means for the User
The result is a smooth line plotted in a separate window below your main chart. Because it uses a long-range weighted calculation, the line acts as a filter:
- It helps differentiate between temporary "noise" (random price jumps) and significant trend shifts.
- By comparing the current price action against this calculated weighted history, traders can better visualize whether the market is overextended or if it has established a new directional momentum.
In essence, this tool provides a stabilized view of market dynamics by balancing a large amount of historical data into a single, readable moving line.
//+------------------------------------------------------------------+
//| PCCI.mq4
//|
//+------------------------------------------------------------------+
#property copyright "Copyright 2002, Finware.ru Ltd."
#property link "http://www.finware.ru/"

#property indicator_separate_window
#property indicator_buffers 1
#property indicator_color1 Blue


//---- buffers
double PCCIBuffer[];

//+------------------------------------------------------------------+
//| Custom indicator initialization function |
//+------------------------------------------------------------------+
int init()
{
string short_name;
//---- indicator line
SetIndexStyle(0,DRAW_LINE);
SetIndexBuffer(0,PCCIBuffer);
SetIndexDrawBegin(0,39);
//----
return(0);
}
//+------------------------------------------------------------------+
//| PCCI |
//+------------------------------------------------------------------+
int start()
{
int i,counted_bars=IndicatorCounted();
double value1;
//----
if(Bars<=38) return(0);
//---- initial zero
if(counted_bars<39)
for(i=1;i<=0;i++) PCCIBuffer[Bars-i]=0.0;
//----
i=Bars-39-1;
if(counted_bars>=39) i=Bars-counted_bars-1;
while(i>=0)
{
value1 =
0.36423990*Close[i+0]
+0.33441085*Close[i+1]
+0.25372851*Close[i+2]
+0.14548806*Close[i+3]
+0.03934469*Close[i+4]
-0.03871426*Close[i+5]
-0.07451349*Close[i+6]
-0.06903411*Close[i+7]
-0.03611022*Close[i+8]
+0.00422528*Close[i+9]
+0.03382809*Close[i+10]
+0.04267885*Close[i+11]
+0.03120441*Close[i+12]
+0.00816037*Close[i+13]
-0.01442877*Close[i+14]
-0.02678947*Close[i+15]
-0.02525534*Close[i+16]
-0.01272910*Close[i+17]
+0.00350063*Close[i+18]
+0.01565175*Close[i+19]
+0.01895659*Close[i+20]
+0.01328613*Close[i+21]
+0.00252297*Close[i+22]
-0.00775517*Close[i+23]
-0.01301467*Close[i+24]
-0.01164808*Close[i+25]
-0.00527241*Close[i+26]
+0.00248750*Close[i+27]
+0.00793380*Close[i+28]
+0.00897632*Close[i+29]
+0.00583939*Close[i+30]
+0.00059669*Close[i+31]
-0.00405186*Close[i+32]
-0.00610944*Close[i+33]
-0.00509042*Close[i+34]
-0.00198138*Close[i+35]
+0.00144873*Close[i+36]
+0.00373774*Close[i+37]
+0.01047723*Close[i+38]
-0.00022625*Close[i+39];

PCCIBuffer[i]=(High[i]+Low[i])/2-value1;

i--;
}
return(0);
}
//+------------------------------------------------------------------+
Comments