Parabolic_ZZ
Download script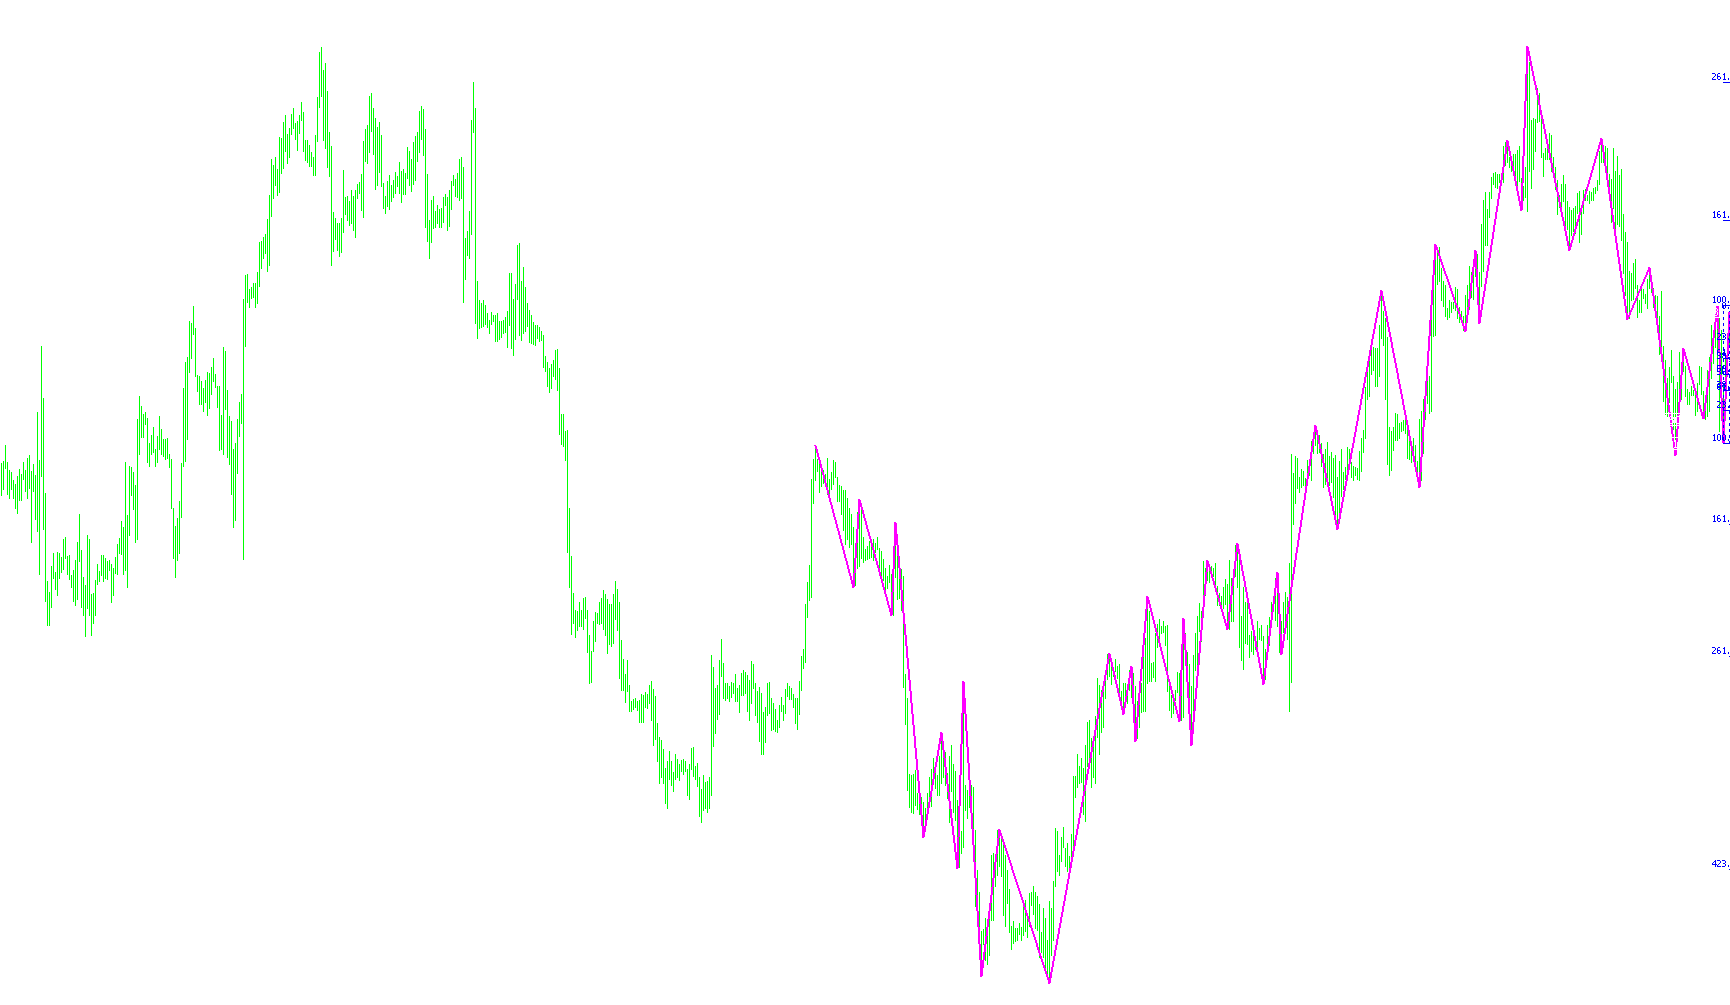
This script is designed to analyze market price movements by identifying significant trend reversals and "zigzag" points. It combines the Parabolic Sar (Stop and Reverse) logic with a structural analysis of the price action to help traders visualize historical swings and key price levels.
Core Logic Overview
The tool operates by scanning a specific number of historical bars (defaulting to 500) to identify when the market shifts from one direction to another. It focuses on two primary actions:
1. Identification of Highs and Lows The script continuously monitors the relationship between the current market price and a calculated Parabolic SAR value. It acts as a filter to determine:
- Peak Detection: When the price moves into an area where the trend suggests a reversal, the tool captures the highest point reached during that movement.
- Trough Detection: Conversely, it captures the lowest point reached during a downward move.
2. Trend Reversal Mapping Instead of marking every minor fluctuation, the logic waits for a definitive "cross." It identifies a transition—such as moving from a high-point reversal to a low-point reversal—and marks these specific coordinates on your chart. This effectively "cleans up" the price action, showing only the significant structural turns rather than the noise in between.
Visual Indicators and Tools
Beyond just tracing lines, the script provides three distinct visual elements to assist with technical analysis:
- Trend Segments: It draws continuous sections (lines) connecting these high and low points, creating a "zigzag" path that reveals the underlying structure of the market trend.
- Price Markers: The tool places specific arrows at key reversal points. These serve as visual anchors for where significant shifts in momentum occurred.
- Automated Fibonacci Levels: One of the more advanced features is its ability to automatically project Fibonacci retracement levels. When it identifies recent waves, it can generate Fibonacci overlays based on the most recent significant peaks and troughs. This allows you to see potential support and resistance zones based on the geometry of previous price swings.
Summary for the Trader
In simple terms, this script takes a complex mathematical indicator (the Parabolic SAR) and uses it as a "rulebook" to draw a simplified map of the market. It filters out small price movements to highlight the major peaks and valleys, automatically marking them with lines, arrows, and Fibonacci levels to help you identify where the market has been and where it might be heading next.
//+------------------------------------------------------------------+
//|                                               Parabolic_ZZ.mq4   |
//|                                       Copyright © 2009, Vic2008  |
//|                                                                  |
//+------------------------------------------------------------------+
#property copyright "Copyright © 2009, Vic2008"
#property link      ""

#property indicator_chart_window
#property indicator_buffers 2
#property indicator_color1 Red
#property indicator_color2 Magenta

//---- input parameters
extern double  SAR_step=0.02;     //Ïàðàìåòðû ïàðàáîëèêà
extern double  SAR_maximum=0.2;

extern int BarsCount = 500;       //Äèñòàíöèÿ â áàðàõ äëÿ îòðèñîâêè èíäèêàòîðà.
//---- buffers
double ExtMapBuffer1[];
double ExtMapBuffer2[];

//+------------------------------------------------------------------+
//| Custom indicator initialization function                         |
//+------------------------------------------------------------------+
int init()
  {
//---- indicators
   SetIndexBuffer(0,ExtMapBuffer1);
   SetIndexStyle(0,DRAW_SECTION);

   SetIndexBuffer(1,ExtMapBuffer2);
   SetIndexStyle(1,DRAW_SECTION,0,2,Magenta);

//----
   return(0);
  }
//+------------------------------------------------------------------+
//| Custom indicator deinitialization function                       |
//+------------------------------------------------------------------+
int deinit()
  {
//----
   ObjectsDeleteAll(0,OBJ_ARROW);
//----
   return(0);
  }
//+------------------------------------------------------------------+
//| Custom indicator iteration function                              |
//+------------------------------------------------------------------+
int start()
  {
   int    counted_bars=IndicatorCounted();
   int w,PosLow,PosHigh;
   double LPic=1000000,HPic=0,price;
   datetime TimeTmp;

//----
   ExtMapBuffer1[0]=Close[0];
   ExtMapBuffer2[0]=EMPTY_VALUE;

 for( w=0;w<BarsCount;w++){

   if( w!=0 ){ ExtMapBuffer1[w]=EMPTY_VALUE; ExtMapBuffer2[w]=EMPTY_VALUE; }

   if( iSAR(NULL,0,SAR_step,SAR_maximum,w) > Close[w] && LPic>=Low[w] ){ LPic=Low[w]; PosLow=w;  }
   if( iSAR(NULL,0,SAR_step,SAR_maximum,w) < Close[w] && HPic<=High[w] ){ HPic=High[w]; PosHigh=w; }

   // H -> L
   if( iSAR(NULL,0,SAR_step,SAR_maximum,(w+1)) > Close[w+1] && iSAR(NULL,0,SAR_step,SAR_maximum,w) < Close[w] && HPic!=0)
   {
        ExtMapBuffer1[PosHigh]=HPic;
        ExtMapBuffer2[PosHigh]=HPic;
        HPic=0;
   }

   // L -> H
   if( iSAR(NULL,0,SAR_step,SAR_maximum,w) < Close[w] && iSAR(NULL,0,SAR_step,SAR_maximum,w+1) > Close[w+1] && LPic!=1000000 )
   {
        ExtMapBuffer1[PosLow]=LPic;
        ExtMapBuffer2[PosLow]=LPic;
        LPic=1000000;
   }


 }


 //Ðèñóåì öåíîâûå ìåòêè è óðîâíè FIBO
 int wave_cnt=0;
 for( w=0;w<BarsCount;w++){
    if( ExtMapBuffer2[w]!=EMPTY_VALUE ){
        if( wave_cnt<=3 ){
          ObjectDelete("PZZ_"+DoubleToStr( wave_cnt, 0));
          ObjectCreate("PZZ_"+DoubleToStr( wave_cnt, 0) , OBJ_ARROW, 0, Time[w], ExtMapBuffer2[w], Time[w], 0);
          ObjectSet("PZZ_"+DoubleToStr( wave_cnt, 0), OBJPROP_ARROWCODE, SYMBOL_LEFTPRICE );
          ObjectSet("PZZ_"+DoubleToStr( wave_cnt, 0), SYMBOL_LEFTPRICE, ExtMapBuffer2[w]);
          ObjectSet("PZZ_"+DoubleToStr( wave_cnt, 0), OBJPROP_COLOR, Gray );

          if(wave_cnt==1){
            ObjectDelete("FiboZZLast");
            ObjectCreate("FiboZZLast", OBJ_FIBO, 0, TimeTmp, ExtMapBuffer2[w], TimeTmp, price);
            ObjectSet("FiboZZLast", OBJPROP_LEVELCOLOR, Blue);
            ObjectSet("FiboZZLast", OBJPROP_COLOR, Blue);
            ObjectSet("FiboZZLast", OBJPROP_RAY , False );
          }

          if(wave_cnt==2){
            ObjectDelete("FiboZZPrev");
            ObjectCreate("FiboZZPrev", OBJ_FIBO, 0, TimeTmp, ExtMapBuffer2[w], TimeTmp, price);
            ObjectSet("FiboZZPrev", OBJPROP_LEVELCOLOR, Blue);
            ObjectSet("FiboZZPrev", OBJPROP_COLOR, Blue);
            ObjectSet("FiboZZPrev", OBJPROP_RAY , False );
          }

        }
        wave_cnt++;
        price=ExtMapBuffer2[w];
        TimeTmp=Time[w];
    }
 }


//----
   return(0);
  }
//+------------------------------------------------------------------+
Comments