paral
Download script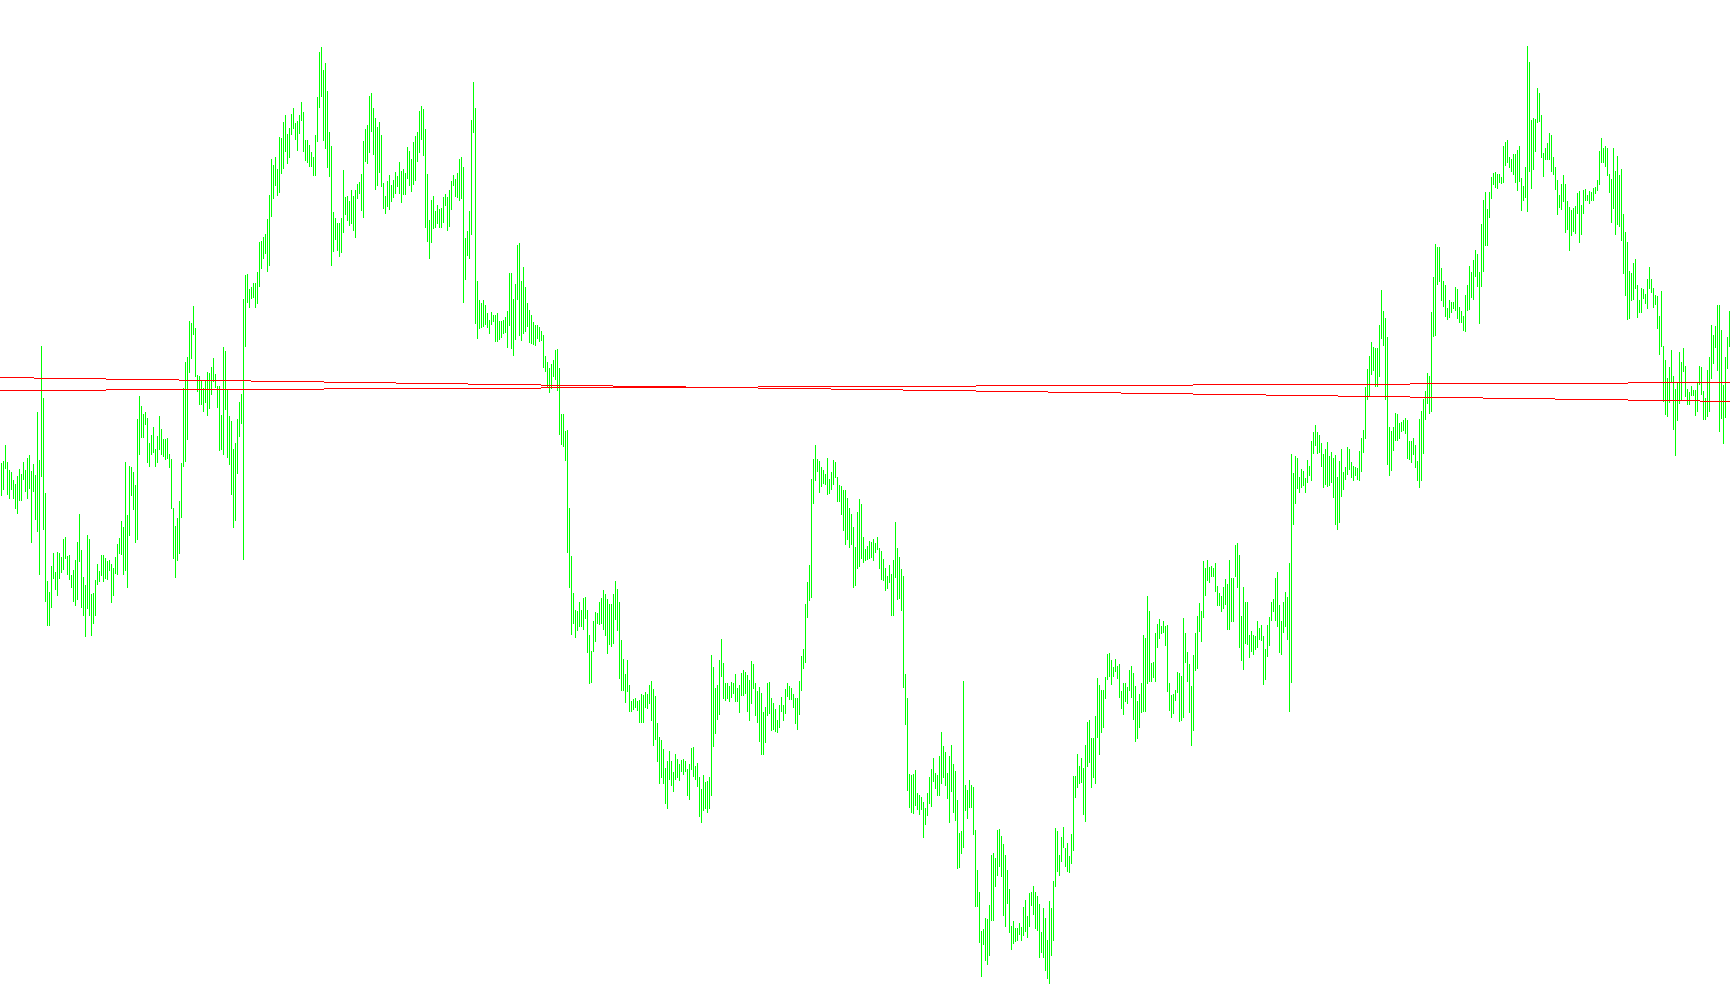
This script is designed as a visual tool for the MetaTrader 4 platform to help traders analyze historical price movements directly on their charts. Rather than acting as an automated trading robot, it functions as a dynamic visual overlay that draws specific trend lines based on historical data.
How the Logic Works
The script operates by scanning a specific window of recent price history—specifically looking back at a set number of bars (defaulting to 300). For every point in this timeframe, the tool performs the following actions:
- Historical Trend Identification: The script looks back at a predetermined period (the "LPeriod") to identify the closing prices. It uses these data points to calculate the direction and slope of the market's movement.
- Automatic Drawing: Once it identifies these movements, it automatically draws trend lines on your chart. Each line connects the price point from the past period to the immediate preceding price point.
- Visual Mapping: By repeating this process across the entire 300-bar range, the script creates a visual map of how the market has shifted over time. This allows a user to see the "path" the price took more clearly than just looking at raw candles or bars alone.
- Real-Time Updates: The logic includes a safety check to ensure it doesn't redraw the entire history every single second. It monitors the total number of bars on the chart; it only triggers its drawing logic when new data arrives or the chart updates significantly, ensuring the platform remains smooth and responsive.
Purpose for the User
The goal of this script is to provide a visual "skeleton" of market trends. By converting historical closing prices into visible trend lines, it helps traders quickly identify patterns, support levels, and previous momentum without having to manually draw dozens of individual lines on the screen.
//+------------------------------------------------------------------+
//|                                                        Paral.mq4 |
//+------------------------------------------------------------------+
#property copyright "© Maloma"

#property indicator_chart_window

//---- input parameters
extern int LPeriod=13;
extern int nBars=300;
       int CBars=0;

//+------------------------------------------------------------------+

int start()
 {
  if (CBars!=Bars)
    for (int i=0;i<=nBars;i++)
     {
      string CN=CurTime();
      if (ObjectCreate(CN,OBJ_TREND,0,iTime(Symbol(),0,LPeriod),Close[LPeriod],iTime(Symbol(),0,1),Close[1],0,0) !=0) Comment(GetLastError());
      ObjectSet(CN, " My_prof_id",0);
     }
   CBars=Bars;
   return(0);
 }
//+------------------------------------------------------------------+
Comments