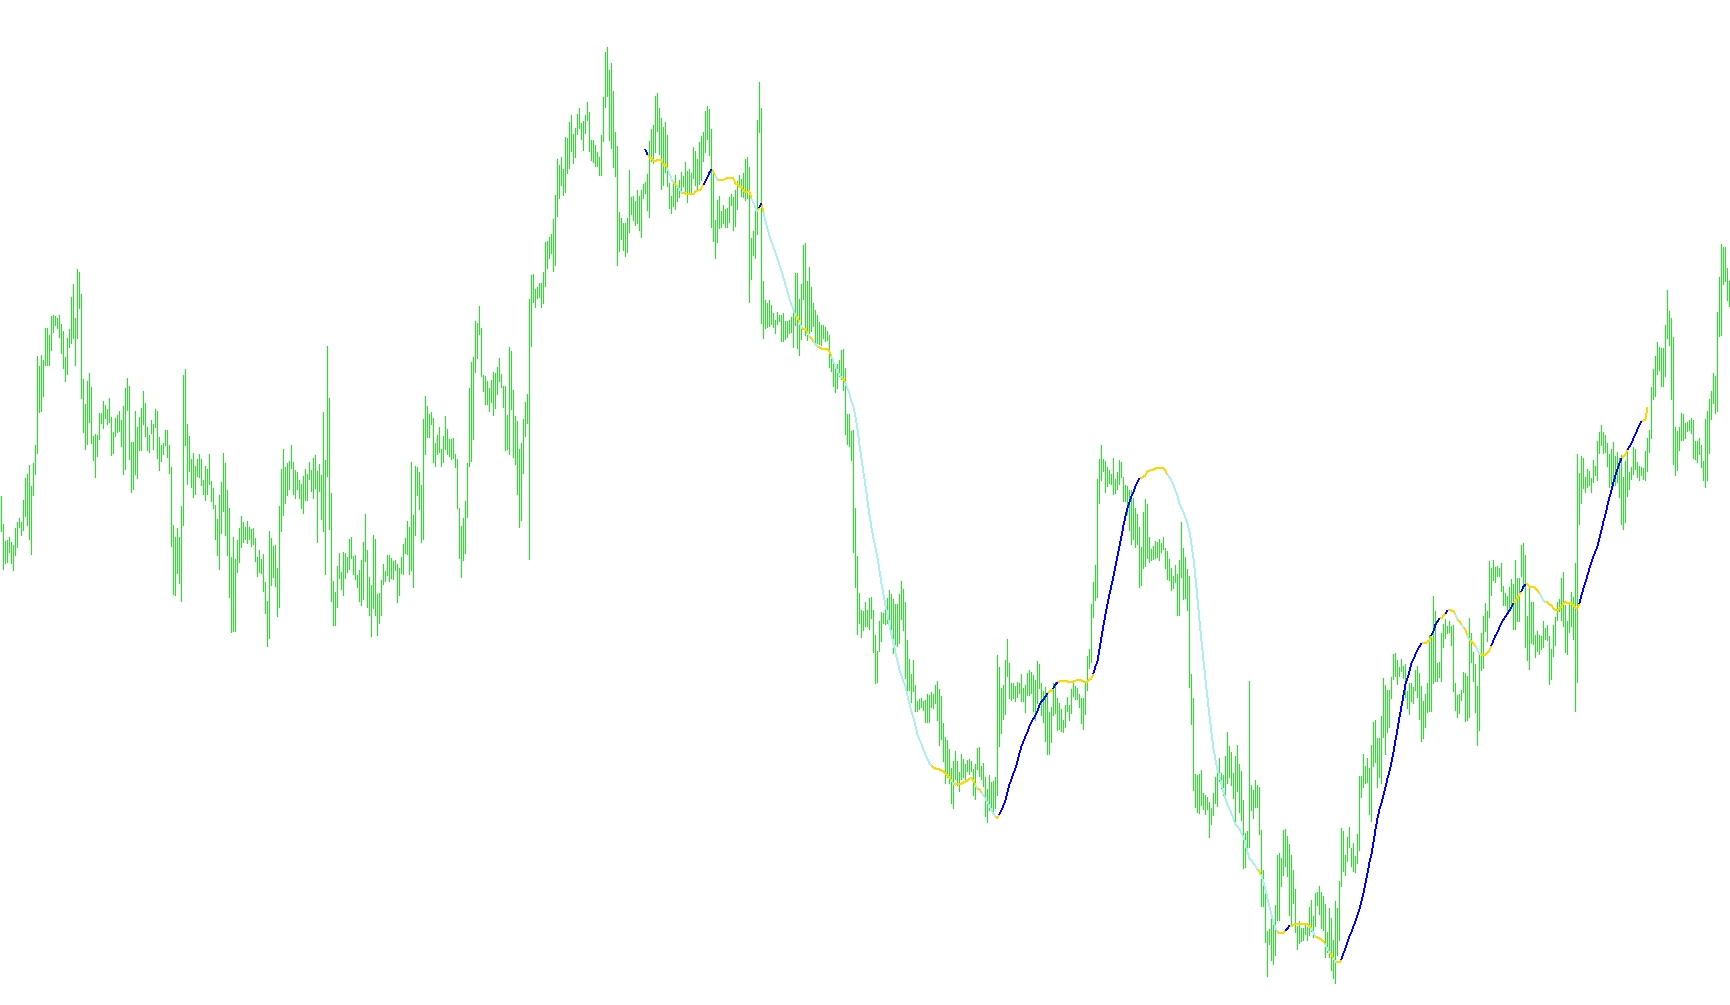
This tool is designed to provide a clear visual representation of market trends by utilizing a specific type of moving average known as the Linear Weighted Moving Average (LSMA). Its primary goal is to simplify price action into easily digestible colors and signals, helping traders identify the direction of the market at a glance.
Core Functionality
The script calculates the LSMA value based on a user-defined period. Unlike standard moving averages that might lag behind price movements, the LSMA focuses on weighting data to provide a more responsive view of where the price is heading.
Dynamic Color Logic
One of the standout features of this tool is its automated color-switching logic. Instead of just showing a single line, the script manages multiple layers of data to change the color of the line on your chart dynamically:
- Green (Rising Trend): The line turns green when the current LSMA value is increasing compared to its previous position, provided it exceeds a specific "slope" threshold.
- Red (Falling Trend): The line turns red when the current LSMA value is decreasing significantly enough to break that same slope threshold.
- Yellow (Neutral/Sideways): When the price movement is too flat or minor to trigger either a "rising" or "falling" status, the indicator defaults to yellow.
Visual Signals and Alerts
Beyond the colored line, the script includes an optional signaling system that can be toggled on or off:
- Trend Arrows: If enabled, the tool places specific arrows on the chart to pinpoint where a trend change is occurring. It distinguishes between strong upward momentum (Green arrows), strong downward momentum (Red arrows), and neutral price action (Yellow boxes/dots).
- Value Tracking: There is an additional option to display the actual numerical difference (the "slope") of the movement directly on the chart as text. This allows you to see exactly how much the trend is accelerating or decelerating in real-time.
Summary for the Trader
Essentially, this tool filters out the "noise" of the market. By looking at the colors and arrows, a trader can quickly determine if the market is trending up (Green), trending down (Red), or resting/consolidating (Yellow), without having to manually calculate slopes or complex price differences.
//+-----------+
//| LSMA      |
//+-----------+
#property  copyright "Copyright 2005 Ron Thompson"
#property  link      "http://www.forexmt4.com/"

/*
This indicator uses LSMA and colors it
red when falling and green when rising.

There is some buffer magic that makes this work.
The order of the buffers and colors is important.

Removing green exposes red
removing red exposes green
removing neither shows yellow (!?!)
*/

//---- indicator settings
#property  indicator_chart_window

#property indicator_buffers   8
#property indicator_color1  Yellow
#property indicator_color2  Green
#property indicator_color3  Red
#property indicator_color4  Green
#property indicator_color5  Red
#property indicator_color6  LawnGreen
#property indicator_color7  Red
#property indicator_color8  Yellow


//---- buffers
double ExtMapBuffer1[];  //Yellow
double ExtMapBuffer2[];  //Green
double ExtMapBuffer3[];  //Red
double XBuffer[];        //White
double ZBuffer[];        //White
double ExtMapBuffer6[];  //Green
double ExtMapBuffer7[];  //Red
double ExtMapBuffer8[];  //Yellow

extern int extRperiod = 58;
extern double extSlope = 6.0;
extern int extDraw4HowLong = 500;
extern bool showarrows=false;
extern bool showarrowvalues=false;

// bar open handling
int    bartime;

//Objects
int    uniq=0;


//+-----------+
//| Init      |
//+-----------+
int init()
  {
   ObjectsDeleteAll();

   SetIndexBuffer(0,ExtMapBuffer1);   //Yellow
   SetIndexStyle(0, DRAW_LINE, STYLE_SOLID, 2);

   SetIndexBuffer(1,ExtMapBuffer2);  //Green
   SetIndexStyle(1, DRAW_LINE, STYLE_SOLID, 2);

   SetIndexBuffer(2,ExtMapBuffer3);  //Red
   SetIndexStyle(2, DRAW_LINE, STYLE_SOLID, 2);


   // 233 up arrow
   // 234 down arrow
   // 158 little dot
   // 159 big dot
   // 168 open square
   // 120 box with X
   SetIndexStyle(3,DRAW_ARROW);
   SetIndexBuffer(3, XBuffer);     //Green
   SetIndexArrow(3,233);

   SetIndexStyle(4,DRAW_ARROW);
   SetIndexBuffer(4, ZBuffer);     //Red
   SetIndexArrow(4,234);

   SetIndexBuffer(5,ExtMapBuffer6);  //Green
   SetIndexStyle(5, DRAW_ARROW);
   SetIndexArrow(5,233);

   SetIndexBuffer(6,ExtMapBuffer7);  //Red
   SetIndexStyle(6, DRAW_ARROW);
   SetIndexArrow(6,234);

   SetIndexBuffer(7,ExtMapBuffer8);  //Yellow
   SetIndexStyle(7, DRAW_ARROW);
   SetIndexArrow(7,120);

   Print("Init complete");
  }

//+-----------+
//| DE-Init   |
//+-----------+
int deinit()
  {
   int i;

   for( i=0; i<Bars; i++ )
     {
      ExtMapBuffer1[i]=0;
      ExtMapBuffer2[i]=0;
      ExtMapBuffer3[i]=0;
      XBuffer[i]=0;
      ZBuffer[i]=0;
      ExtMapBuffer6[i]=0;
      ExtMapBuffer7[i]=0;
      ExtMapBuffer8[i]=0;
     }
   ObjectsDeleteAll();
   Print("DE-Init complete");
  }


//+-----------+
//| Each Tick |
//+-----------+
int start()
  {
   int    pos;

   double wtp; //LSMA previous value
   double wt;  //LSMA current value
   double wd;  //difference

   string sColor;

   double pSlope=extSlope*Point;

   // draw once at open of bar
   if(bartime==Time[0]) return(0);
   bartime=Time[0];

   for(pos = extDraw4HowLong; pos >= 0; pos--)
     {
      //save previous value
      wtp = wt;
      //get next bar LSMA
      wt  = LSMA(pos);
      //calculate difference
      wd = (wt-wtp)/Point;

      // draw actual LSMA line
      ExtMapBuffer1[pos] = wt;   //yellow
      ExtMapBuffer2[pos] = wt;   //green
      ExtMapBuffer3[pos] = wt;   //red
      if (wtp < wt+(pSlope))  //rising, remove RED
        {
         ExtMapBuffer3[pos] = EMPTY_VALUE;
        }

      if (wtp > wt-(pSlope)) //falling, remove GREEN
        {
         ExtMapBuffer2[pos] = EMPTY_VALUE;
        }

      if(showarrows)
        {
         // Draw arrows that reflect the REAL difference levels
         sColor="YELLOW";

         if (wd > 0.0 && wd > extSlope )         //rising
           {
            sColor="GREEN";
            ExtMapBuffer6[pos]=wt;//+(10*Point);
           }
         if (wd < 0.0 && wd < (extSlope*(-1)) )  //falling
           {
            sColor="RED";
            ExtMapBuffer7[pos]=wt;//+(10*Point);
           }
         if (sColor=="YELLOW")  //static - within slope
           {
            ExtMapBuffer8[pos]=wt;//+(10*Point);
           }
        }

      if(showarrowvalues)
        {
         ObjectCreate("myx"+DoubleToStr(uniq,0), OBJ_TEXT, 0, Time[pos], wt );
         ObjectSetText("myx"+DoubleToStr(uniq,0),DoubleToStr(wd,0),15,"Arial",White);
         uniq++;
        }

     }//for

  }//start

double LSMA(int mybar)
  {
   int    i;
   double sum=0;
   double lengthvar = ( extRperiod + 1.0 ) / 3.0;

   for(i = extRperiod; i >= 1  ; i--)
     {
      sum += ( i - lengthvar)*Open[extRperiod - i + mybar];
     }
   return(sum * 6 / (extRperiod*(extRperiod + 1)) );
  }
Comments