LSMA_v2
Download script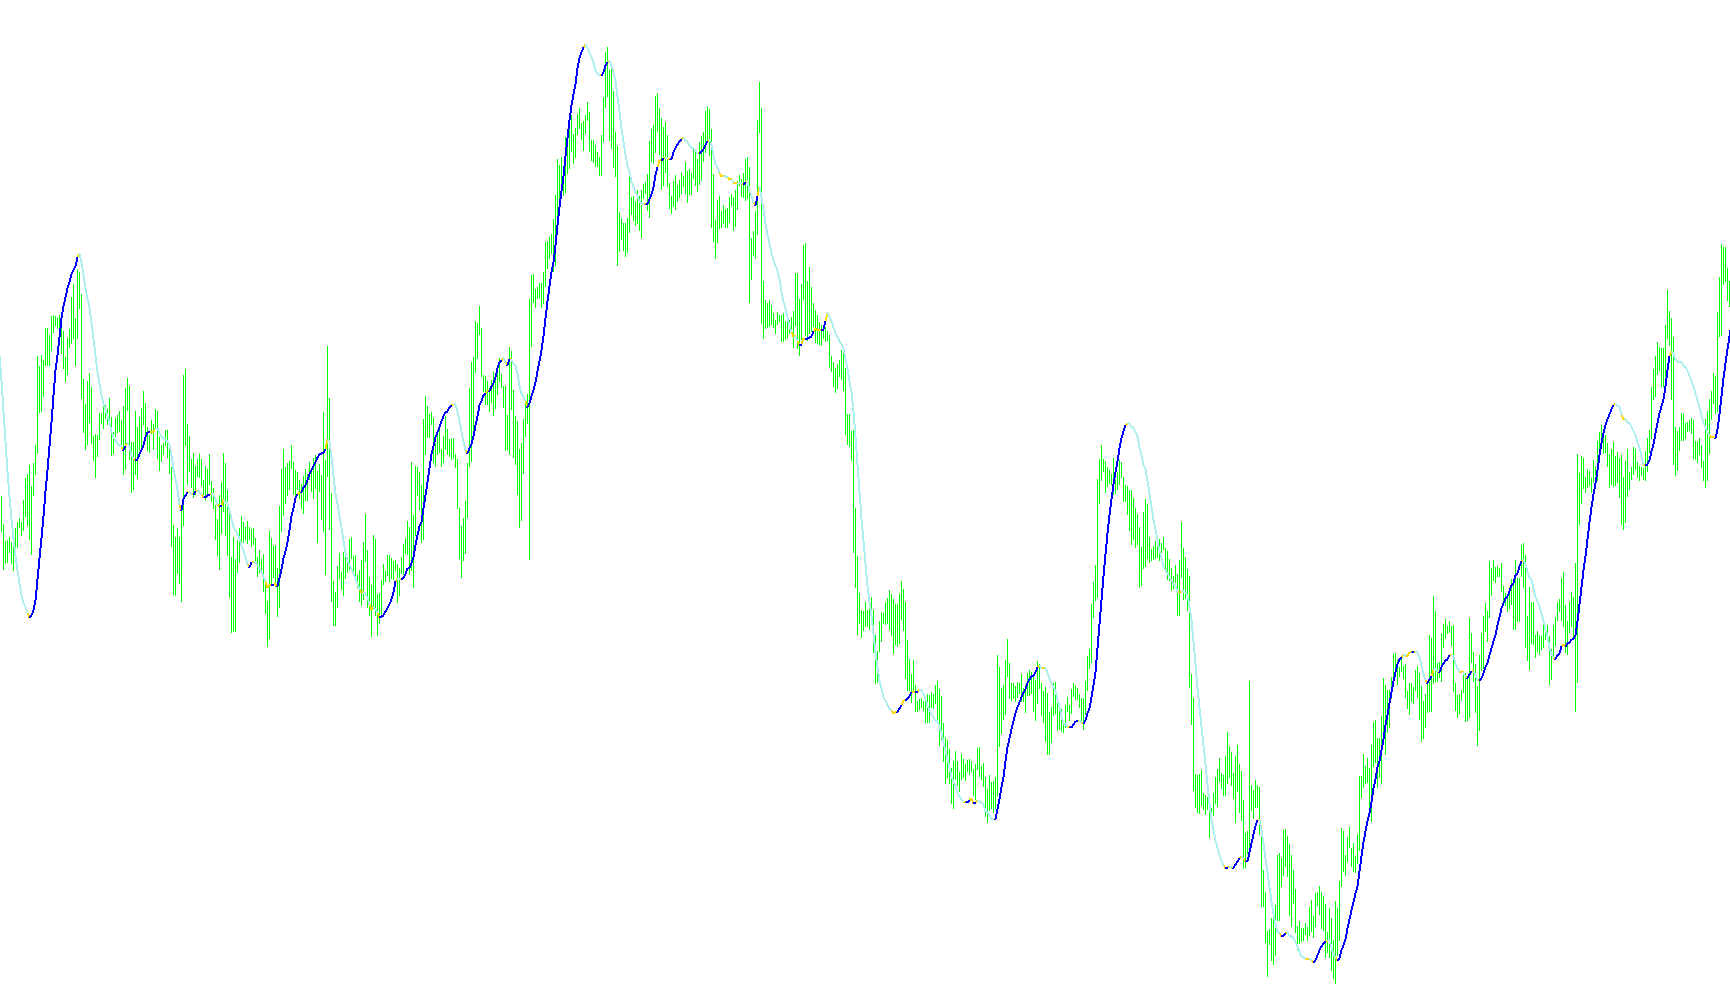
This script is designed as a visual trading tool for the MetaTrader platform, specifically engineered to help traders identify trends and momentum shifts through a dynamic, color-coded moving average. Unlike standard indicators that only show a single line, this tool uses a sophisticated calculation method to provide clear visual cues about price direction.
Core Logic and Functionality
The Calculation Engine At its heart, the script employs a weighted mathematical approach. Rather than treating all historical price data equally, it applies a specific weight to different points in time. By giving more significance to more recent price movements while still accounting for historical context, the indicator creates a "smoothed" representation of the market's path. This helps filter out minor market noise and focuses on the underlying trend.
Visual Trend Identification The primary purpose of this script is to translate complex mathematical data into easy-to-read visual signals. It operates by comparing the current calculated value against the previous one to determine direction:
- Upward Momentum: When the indicator detects that the price movement is gaining strength or trending upward, it highlights the trend accordingly.
- Downward Momentum: Conversely, when the calculation identifies a decline in value, the visual output shifts to reflect this decrease.
- Dynamic Coloring: The script uses three distinct color buffers (Yellow, Green, and Red) to represent these transitions. By dynamically "turning on" or "turning off" specific colors based on whether the trend is rising or falling, it allows a trader to see at a glance whether the market is in a bullish or bearish state without having to manually interpret raw numbers.
Key Benefits for Traders
- Simplified Analysis: By converting raw price data into a color-coded moving average, it reduces the cognitive load on the trader. You can quickly identify the "flow" of the market.
- Smooth Transitions: Because it uses weighted calculations, the indicator avoids the jagged, erratic movements often seen in basic moving averages, providing a more stable visual guide for trend following.
- Real-Time Visual Feedback: The script automatically updates the colors on your chart as new price data arrives, ensuring that the visual representation of the market sentiment is always current.
/*-----------------------------+
|			       |
| Shared by www.Aptrafx.com    |
|			       |
+------------------------------*/

//LSMA in Color mq4
//+------------------------------------------------------------------+
//| |
//| Copyright © 2004, MetaQuotes Software Corp. |
//| http://www.metaquotes.net/ |
//+------------------------------------------------------------------+
#property copyright "Copyright © 2005, FX Sniper "
#property link "http://www.metaquotes.net/"

//---- indicator settings
#property indicator_separate_window
#property indicator_buffers 3
#property indicator_color1 Yellow
#property indicator_color2 Green
#property indicator_color3 Red

//---- buffers
double ExtMapBuffer1[];
double ExtMapBuffer2[];
double ExtMapBuffer3[];
int width;

extern int Rperiod = 34;
extern int Draw4HowLongg = 1500;
int Draw4HowLong;
int shift;
int i;
int loopbegin;
double sum[];
int length;
double lengthvar;
double tmp ;
double wt[];
int c;

//+------------------------------------------------------------------+
//| Custom indicator initialization function |
//+------------------------------------------------------------------+
int init()
{
//---- 2 additional buffers are used for counting.
IndicatorBuffers(5);

//---- drawing settings
SetIndexBuffer(2,ExtMapBuffer1);
SetIndexBuffer(1,ExtMapBuffer2);
SetIndexBuffer(0,ExtMapBuffer3);
SetIndexBuffer(3,sum);
SetIndexBuffer(4,wt);

SetIndexStyle(2,DRAW_LINE,STYLE_SOLID,2);
SetIndexStyle(1,DRAW_LINE,STYLE_SOLID,2);
SetIndexStyle(0,DRAW_LINE,STYLE_SOLID,2);

//---- initialization done
return(0);
}

int start()

{ Draw4HowLong = Bars-Rperiod - 5;
length = Rperiod;
loopbegin = Draw4HowLong - length - 1;

for(shift = loopbegin; shift >= 0; shift--)
{
sum[1] = 0;
for(i = length; i >= 1 ; i--)
{
lengthvar = length + 1;
lengthvar /= 3;
tmp = 0;
tmp = ( i - lengthvar)*Close[length-i+shift];
sum[1]+=tmp;
}
wt[shift] = sum[1]*6/(length*(length+1));

//========== COLOR CODING ===========================================

ExtMapBuffer3[shift] = wt[shift]; //red
ExtMapBuffer2[shift] = wt[shift]; //green
ExtMapBuffer1[shift] = wt[shift]; //yellow

// for(c=loopbegin;c==shift;c++)
// {
if (wt[shift+1] > wt[shift])
{
ExtMapBuffer2[shift+1] = EMPTY_VALUE;
// ObjectCreate("smiley_face", OBJ_ARROW, 0, Time[shift], Low[shift]-Point*20);
// Print("time= ",Time[shift]);
// ObjectSet("smiley_face", OBJPROP_ARROWCODE, 242);
// ObjectSet("smiley_face", OBJPROP_COLOR , Red);
// ObjectSet("smiley_face", OBJPROP_WIDTH , 1);
// ObjectsRedraw();

//ExtMapBuffer3[shift+1] = EMPTY_VALUE;
//ExtMapBuffer3[shift+1] = EMPTY_VALUE;

}
else if (wt[shift+1] < wt[shift])
{
ExtMapBuffer1[shift+1] = EMPTY_VALUE; //-1 red/greem tight
//ExtMapBuffer3[shift+1] = EMPTY_VALUE;

}
else
{

ExtMapBuffer1[shift+1]=CLR_NONE;//EMPTY_VALUE;
ExtMapBuffer2[shift+1]=CLR_NONE;//EMPTY_VALUE;
}

}

return(0);
}
//+------------------------------------------------------------------+
Comments