LSwpr_in_Color
Download script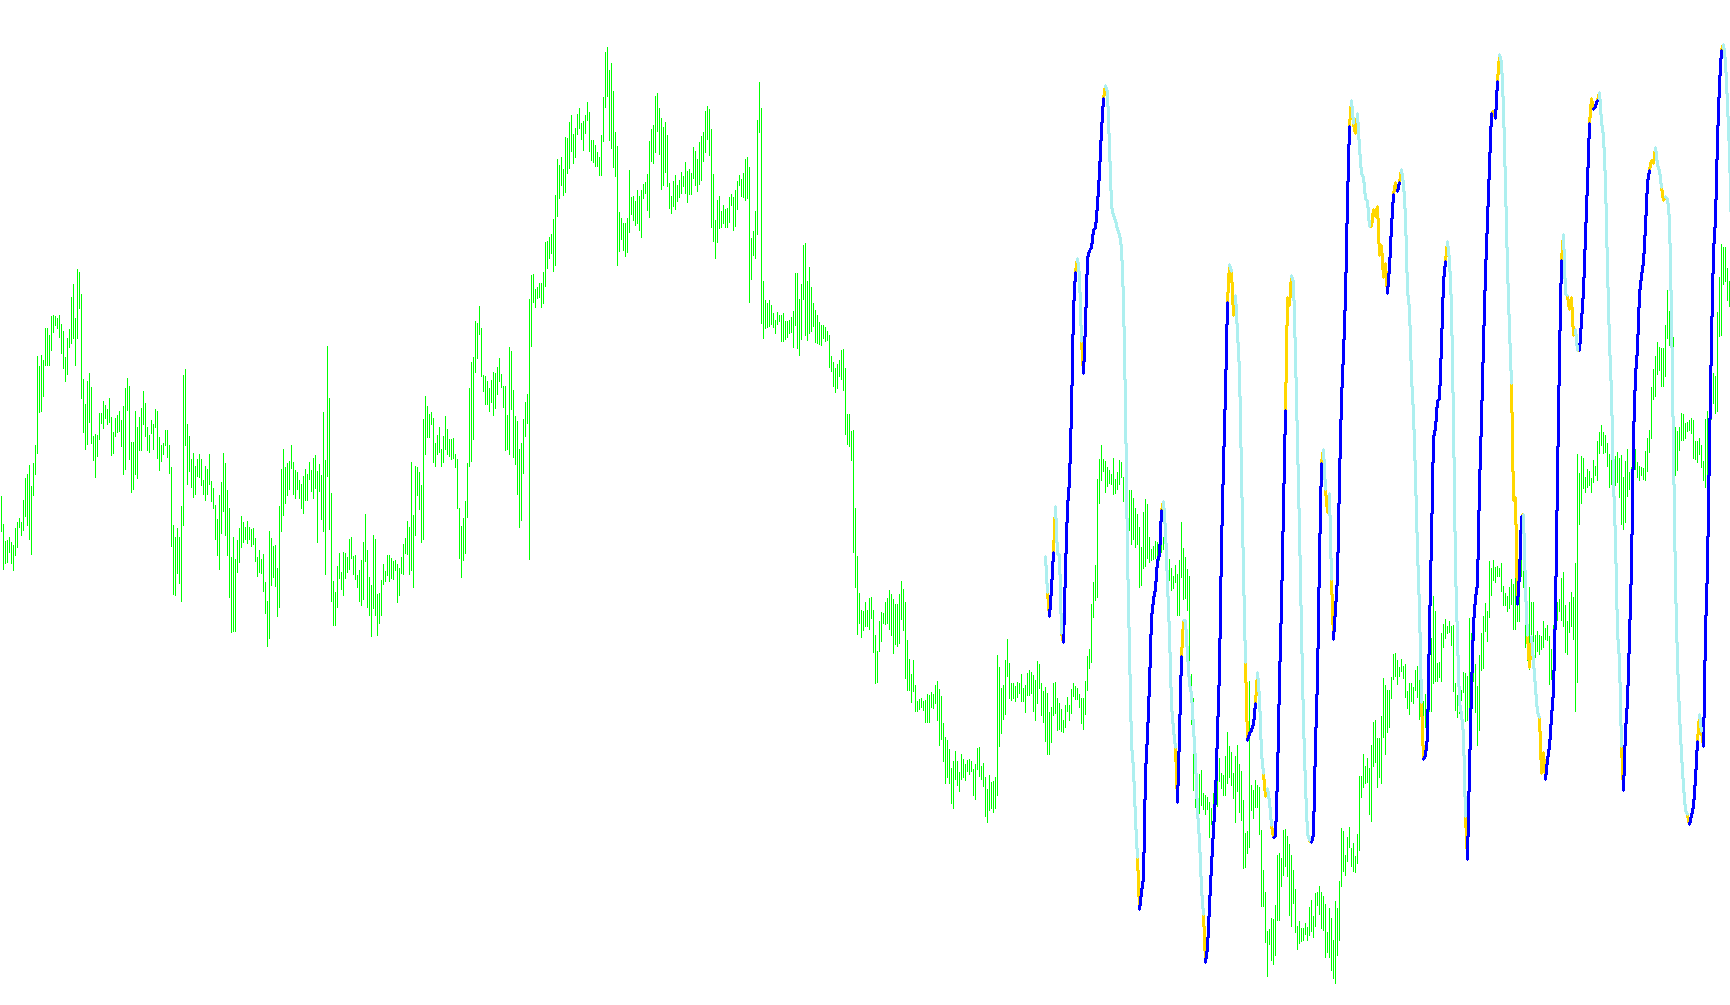
This tool is designed as a visual aid for traders to identify momentum and trend direction on a currency or asset chart. It functions by analyzing historical price data over a specific period to calculate a weighted movement value, which is then displayed in a separate window below the main price action.
Core Logic and Methodology
The script operates by looking back at a user-defined number of bars (the "Rperiod"). Instead of simply looking at the current price, it performs the following steps:
- Data Aggregation: It collects price data for every candle within the specified period.
- Weighted Calculation: Rather than treating every historical candle equally, the script applies a mathematical weight to the data. It assigns different importance to older vs. newer data points within that period. This ensures that the resulting value is more reflective of recent price behavior while still acknowledging the overall trend of the window.
- Momentum Tracking: The tool calculates a cumulative sum of these weighted values to produce a single output line. This line represents the "momentum" or the underlying strength of the market's movement during that timeframe.
Visual Representation
The script translates these complex calculations into a clear visual format on your screen:
- Color-Coded Trends: The indicator uses three distinct colors (Yellow, Chartreuse/Green, and Red) to represent different states of the trend.
- Dynamic Directional Shifts: The logic compares the current calculated value with the previous one.
- When the momentum value moves in a specific direction, the script highlights that movement by keeping the corresponding line visible.
- When the momentum changes or stays flat, the script "clears" the opposite color.
- Visual Clarity: By intentionally emptying out certain colors based on whether the values are increasing or decreasing, the tool helps the trader quickly distinguish between upward pressure and downward pressure without having to interpret raw numbers.
Summary for the User
Essentially, this script acts as a momentum filter. It smooths out the "noise" of standard price fluctuations by weighing historical data, then paints a visual path that highlights whether the current market energy is trending upwards or downwards. It allows you to see the strength of a move more clearly than a standard price chart alone might provide.
//+------------------------------------------------------------------+
//|                                                        |
//|                      Copyright © 2004, MetaQuotes Software Corp. |
//|                                       http://www.metaquotes.net/ |
//+------------------------------------------------------------------+
#property  copyright "Copyright © 2005, FX Sniper "
#property  link      "http://www.metaquotes.net/"

//---- indicator settings
#property  indicator_separate_window
#property  indicator_buffers 3
#property indicator_color1 Yellow
#property indicator_color2 Chartreuse
#property indicator_color3 Red

//---- buffers
double ExtMapBuffer1[];
double ExtMapBuffer2[];
double ExtMapBuffer3[];
int width;

extern int Rperiod = 14;
extern int BarProcessed = 300;
int shift;
int i;
int loopbegin;
double sum[];
int length;
double lengthvar;
double tmp ;
double wt[];
int c;

//+------------------------------------------------------------------+
//| Custom indicator initialization function                         |
//+------------------------------------------------------------------+
int init()
  {
//---- 2 additional buffers are used for counting.
   IndicatorBuffers(5);

//---- drawing settings
   SetIndexBuffer(2,ExtMapBuffer1);
   SetIndexBuffer(1,ExtMapBuffer2);
   SetIndexBuffer(0,ExtMapBuffer3);
   SetIndexBuffer(3,sum);
   SetIndexBuffer(4,wt);

   SetIndexStyle(2,DRAW_LINE,STYLE_SOLID,3);
   SetIndexStyle(1,DRAW_LINE,STYLE_SOLID,3);
   SetIndexStyle(0,DRAW_LINE,STYLE_SOLID,3);

//---- initialization done
   return(0);
  }

int start()
   {
   if (Bars < Rperiod+1)  BarProcessed = Bars-Rperiod-1;
	if (Bars < Rperiod+1)  return;
	if (BarProcessed ==0) BarProcessed = Bars-Rperiod-1;

   length = Rperiod;
   loopbegin = BarProcessed;

   for(shift = loopbegin; shift >= 0; shift--)
      {
      sum[1] = 0;
      for(i = length; i >= 1  ; i--)
         {
         lengthvar = length + 1;
         lengthvar /= 3;
         tmp = 0;
         tmp = ( i - lengthvar)*iWPR(NULL,0,Rperiod,length-i+shift);

         sum[1]+=tmp;
         }

      wt[shift] = sum[1]*6/(length*(length+1));

      ExtMapBuffer3[shift] = wt[shift]; //red
      ExtMapBuffer2[shift] = wt[shift]; //green
      ExtMapBuffer1[shift] = wt[shift]; //yellow

      if (wt[shift+1] > wt[shift])
         {
         ExtMapBuffer2[shift+1] = EMPTY_VALUE;
         } else if (wt[shift+1] < wt[shift]) {
         ExtMapBuffer1[shift+1] = EMPTY_VALUE; //-1 red/greem tight
         } else {
         ExtMapBuffer1[shift+1] = CLR_NONE;//EMPTY_VALUE;
         ExtMapBuffer2[shift+1] = CLR_NONE;//EMPTY_VALUE;
         }

      }
      return(0);
   }
Comments