MA Chanels FiboEnv Mid
Download script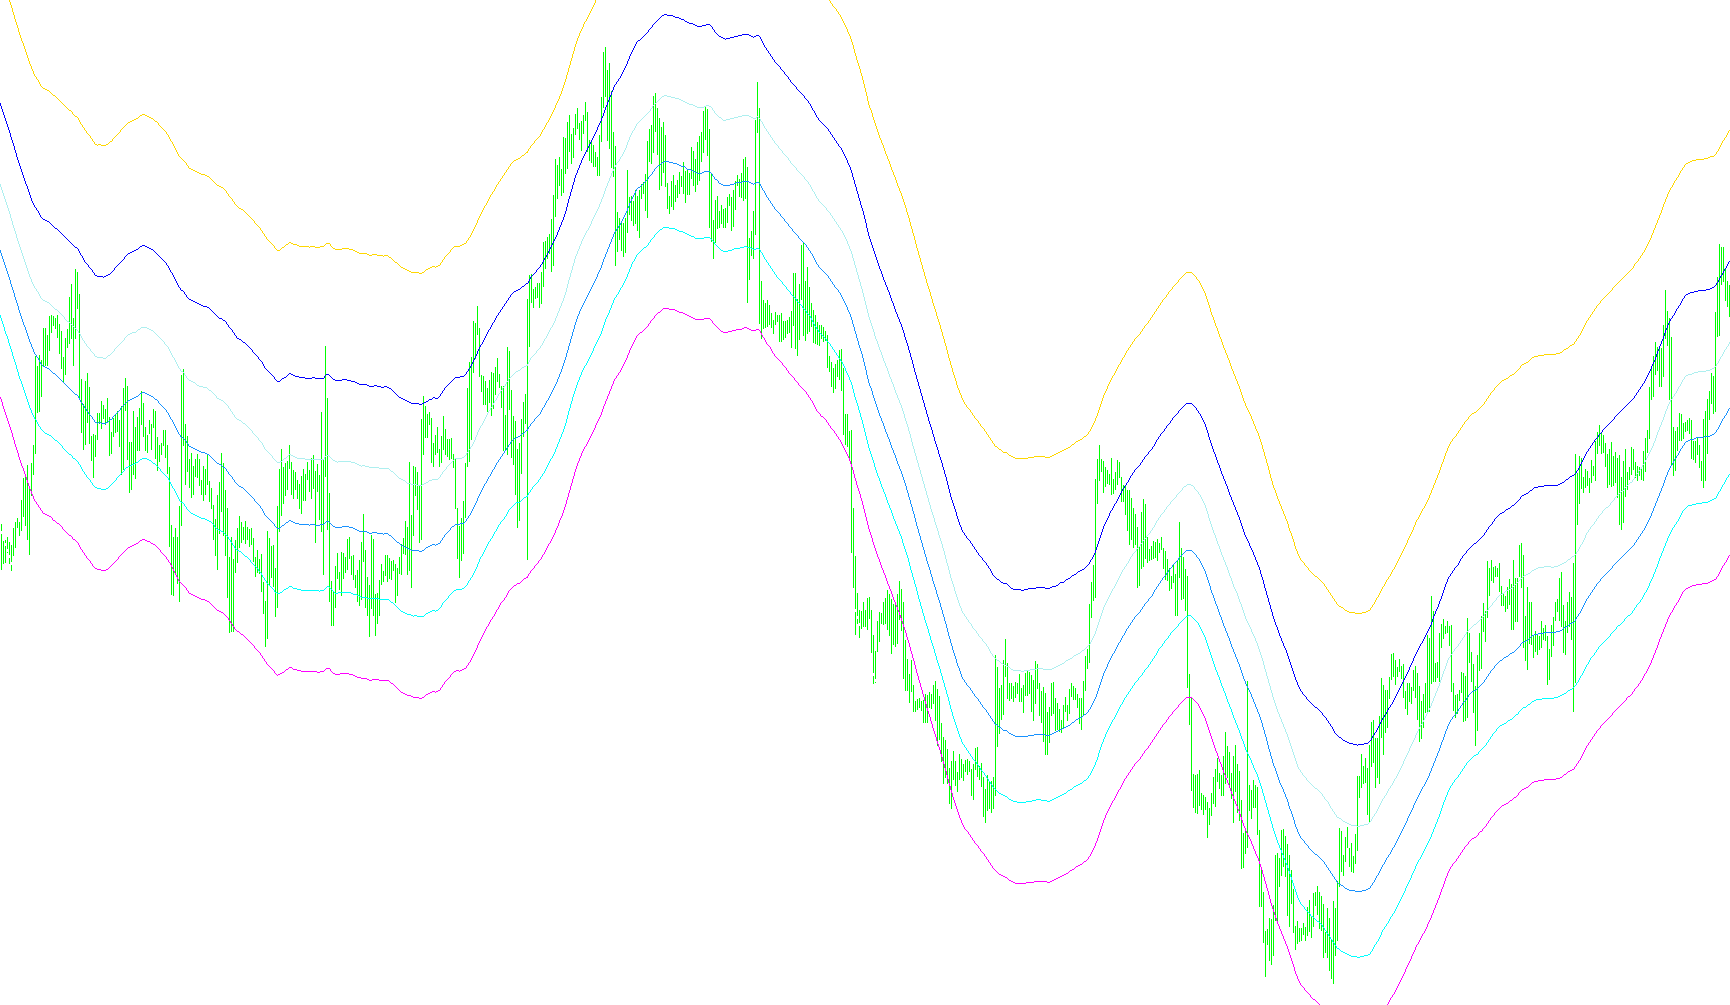
The MA Channels FiboEnv Mid is a technical analysis tool designed to help traders visualize market volatility and potential price zones by combining moving averages with Fibonacci retracement principles. Instead of simply showing a single average price line, this indicator creates a multi-layered "channel" or environment around the price action.
Core Logic Overview
The script functions through a three-step mathematical process:
1. Establishing the Baseline The tool first calculates a Moving Average (MA) based on your preferred settings (such as period and calculation method). This average serves as the "center" of the trading environment, representing thesmoothed trend of the market.
2. Measuring Volatility Range
To determine how wide the channel should be, the script scans a specific number of past price bars (defined by the BarsCount parameter). During this scan:
- It identifies the highest distance between the market's "High" price and the Moving Average.
- It identifies the lowest distance between the market's "Low" price and the Moving Average.
- By finding these extremes, the script calculates the total "swing" or volatility of the asset over that period.
3. Generating Fibonacci Channels Once the total volatility range is established, the script applies specific Fibonacci ratios to create seven distinct lines on your chart. These lines are plotted relative to the Moving Average:
- The Center Line: The primary Moving Average itself.
- Upper & Lower Zones: The script projects various percentages (such as 11.8%, 26.4%, and 50%) above and below the center line.
How to Read the Results
Rather than just showing you where the price is, this indicator shows you a "map" of where the price could go based on historical volatility:
- Dynamic Scaling: Because the channel is based on real volatility, it will expand during periods of high market activity and contract when the market becomes quiet.
- Support and Resistance Visualization: The multiple lines provide a visual guide for potential support and resistance levels. Traders can use these "Fibonacci envelopes" to identify areas where price might stall, accelerate, or reverse.
- Trend Context: By looking at where the current price sits in relation to these seven lines, you can better understand if the market is overextended (pushing into the outer edges) or consolidating near the center moving average.
//+------------------------------------------------------------------+
//|                           MA Chanels FiboEnv Mid.mq4             |
//|                                                           °njel° |
//|                                           iamnotlinked   mod. ik |
//+------------------------------------------------------------------+
#property copyright "°njel°"
#property link      "iamnotlinked"

#property indicator_chart_window
#property indicator_buffers 7

#property indicator_color1 MediumOrchid
#property indicator_color2 Violet
#property indicator_color3 MediumOrchid
#property indicator_color4 Violet
#property indicator_color5 MediumOrchid
#property indicator_color6 Violet
#property indicator_color7 MediumOrchid
//---- input parameters
extern int BarsCount = 1000;
extern int MAPeriod=55;
extern int MAMethod=MODE_SMA;
extern int MAPrice=4;
extern int MAShift=0;
double  max =0;
double  min =0;
double    Inc1 = 0.0000;
double    Inc2 = 0.0000;
double    Inc3 = 0.0000;
double    Inc4 = 0.0000;
//
/***
PRICE_CLOSE    0 Close price.
PRICE_OPEN     1 Open price.
PRICE_HIGH     2 High price.
PRICE_LOW      3 Low price.
PRICE_MEDIAN   4 Median price, (high+low)/2.
PRICE_TYPICAL  5 Typical price, (high+low+close)/3.
PRICE_WEIGHTED 6 Weighted close price, (high+low+close+close)/4
MAMethod
MODE_SMA    0 Simple moving average,
MODE_EMA    1 Exponential moving average,
MODE_SMMA   2 Smoothed moving average,
MODE_LWMA   3 Linear weighted moving average.

***/

extern int ____;
extern int Note;
extern int ______;
extern int priceClose_0__priceOpen_1;
extern int priceHigh_2__priceLow_3;
extern int priceMedian_4__priceTypical_5;
extern int priceWeightedclose_6;
extern int _______;
extern int MA_Method;
extern int SMA_0_EMA1_SMMA2_LWMA3;

//---- buffers
double ExtMapBuffer1[];
double ExtMapBuffer2[];
double ExtMapBuffer3[];
double ExtMapBuffer4[];
double ExtMapBuffer5[];
double ExtMapBuffer6[];
double ExtMapBuffer7[];

//+------------------------------------------------------------------+
//| Custom indicator initialization function                         |
//+------------------------------------------------------------------+
int init()
  {
//---- indicators
   SetIndexStyle(0,DRAW_LINE);
   SetIndexBuffer(0,ExtMapBuffer1);
   SetIndexShift(0,MAShift);
   SetIndexLabel(0,"FibMA"+MAPeriod+"Up100%");

   SetIndexStyle(1,DRAW_LINE);
   SetIndexBuffer(1,ExtMapBuffer2);
   SetIndexShift(1,MAShift);
   SetIndexLabel(1,"FibMA"+MAPeriod+"Dn23.5%");

   SetIndexStyle(2,DRAW_LINE);
   SetIndexBuffer(2,ExtMapBuffer3);
 SetIndexShift(2,MAShift);
   SetIndexLabel(2,"FibMA"+MAPeriod+"Dn38.2,Up61.8");

   SetIndexStyle(3,DRAW_LINE);
   SetIndexBuffer(3,ExtMapBuffer4);
  SetIndexShift(3,MAShift);
   SetIndexLabel(3,"FibMA"+MAPeriod+"50%");

   SetIndexStyle(4,DRAW_LINE);
   SetIndexBuffer(4,ExtMapBuffer5);
  SetIndexShift(4,MAShift);
   SetIndexLabel(4,"FibMA"+MAPeriod+"Up38.2,Dn61.8");

   SetIndexStyle(5,DRAW_LINE);
   SetIndexBuffer(5,ExtMapBuffer6);
  SetIndexShift(5,MAShift);
   SetIndexLabel(5,"FibMA"+MAPeriod+"Up23.5%");

   SetIndexStyle(6,DRAW_LINE);
   SetIndexBuffer(6,ExtMapBuffer7);
  SetIndexShift(6,MAShift);
   SetIndexLabel(6,"FibMA"+MAPeriod+"Dn100%");

  IndicatorShortName ("MA Chanels FiboEnv Mid("+MAPeriod+")");

//----
   return(0);
  }
//+------------------------------------------------------------------+
//| Custom indicator deinitialization function                       |
//+------------------------------------------------------------------+
int deinit()
  {
   max =0;
   min =0;
   return(0);
  }
//+------------------------------------------------------------------+
//| Custom indicator iteration function                              |
//+------------------------------------------------------------------+
int start()
  {
   max =0;
   min =0;


   if (iBars(NULL,0) < BarsCount)
      BarsCount = iBars(NULL,0) -MAPeriod-1 ;

   for (int i =BarsCount; i>=0; i--)
   {

      double m = iMA(NULL,0,MAPeriod,0,MAMethod,MAPrice,i);
      double top = High[i] - m;
      if (top > max)
         max = top;

      double bottom = Low[i] - m;
      if (bottom < min)
         min = bottom;

   }

   if (MathAbs(max) >  MathAbs(min))
      Inc4 = max;
      else
      Inc4 = min;

      Inc1 = (max-min)*0.118;
      Inc2 = (max-min)*0.264;
      Inc3 = (max-min)*0.5;


   for (i =BarsCount; i>=0; i--)
   {
      ExtMapBuffer1[i] = iMA(NULL,0,MAPeriod,0,MAMethod,MAPrice,i) + Inc3;
      ExtMapBuffer2[i] = iMA(NULL,0,MAPeriod,0,MAMethod,MAPrice,i) + Inc2 ;
      ExtMapBuffer3[i] = iMA(NULL,0,MAPeriod,0,MAMethod,MAPrice,i) + Inc1 ;
      ExtMapBuffer4[i] = iMA(NULL,0,MAPeriod,0,MAMethod,MAPrice,i);
      ExtMapBuffer5[i] = iMA(NULL,0,MAPeriod,0,MAMethod,MAPrice,i) - Inc1;
      ExtMapBuffer6[i] = iMA(NULL,0,MAPeriod,0,MAMethod,MAPrice,i) - Inc2;
      ExtMapBuffer7[i] = iMA(NULL,0,MAPeriod,0,MAMethod,MAPrice,i) - Inc3;


   }

   return(0);
  }
//+------------------------------------------------------------------+
Comments