LWMA2
Download script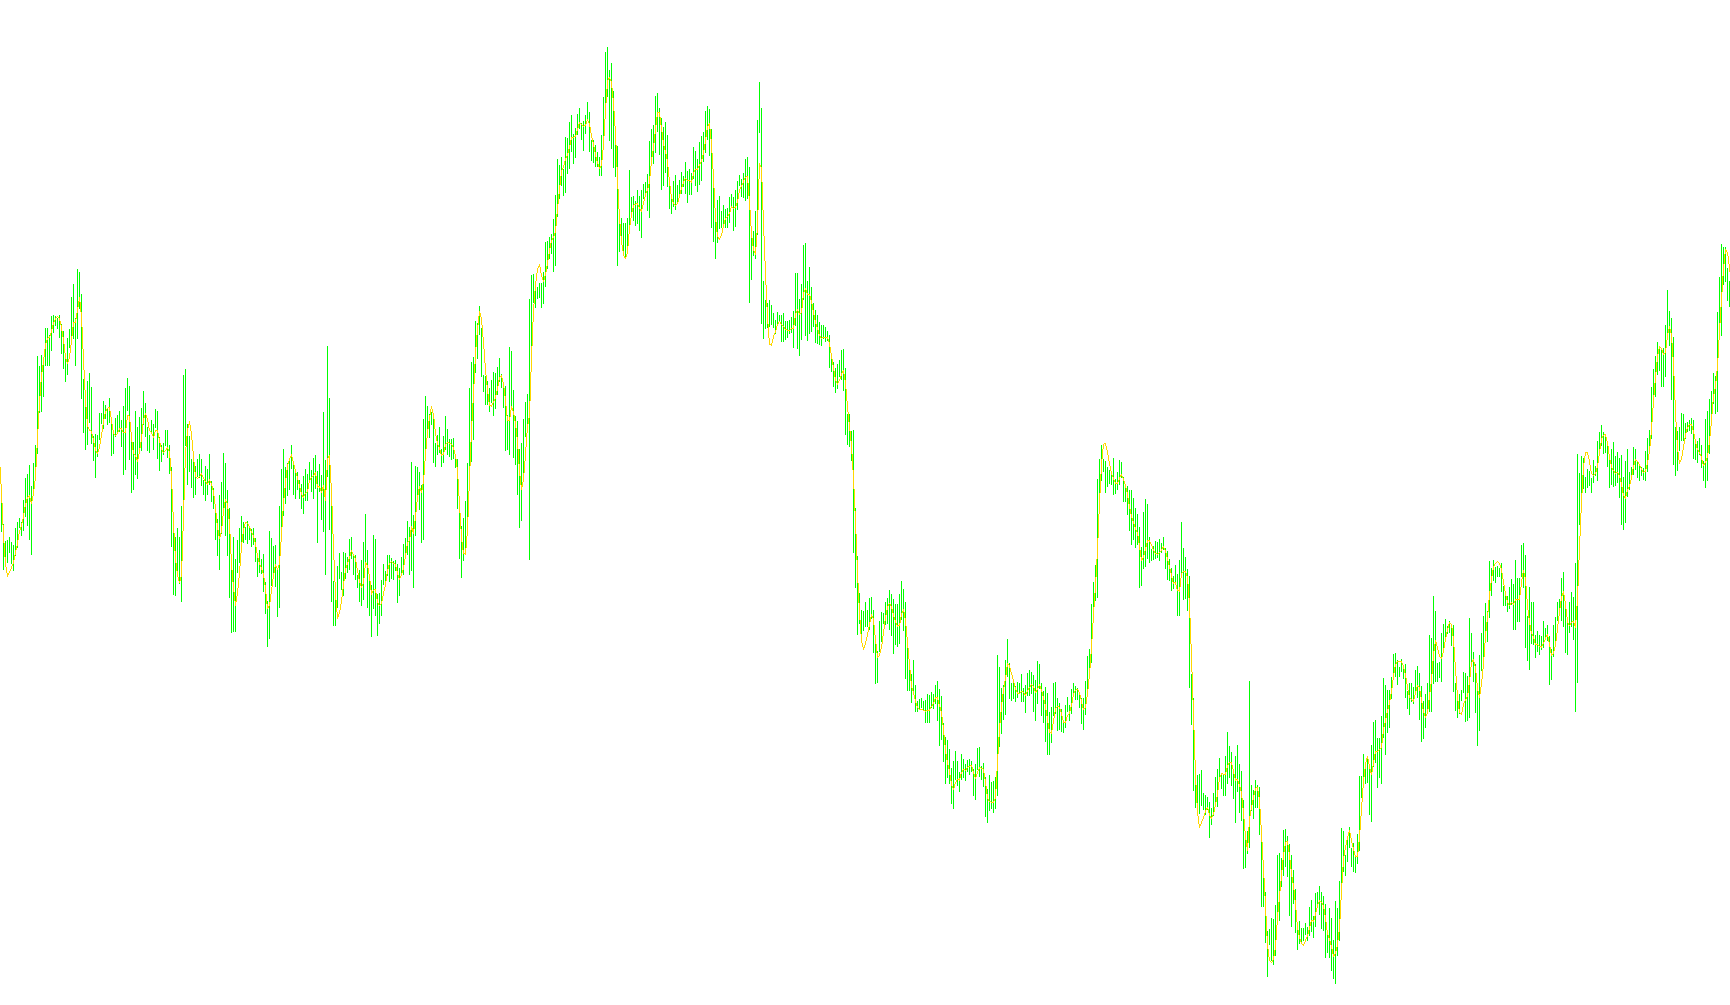
This tool is designed to provide traders with a visual representation of momentum and price trends by analyzing the relationship between two different moving averages. Instead of simply plotting two separate lines on your chart, it calculates the mathematical difference between them to highlight specific market dynamics.
Core Logic and Mechanics
1. Dual Moving Average Foundation The script works by tracking two distinct "Moving Averages." These are indicators that smooth out price fluctuations to help identify the underlying trend. The script specifically uses a "Linear Weighted Moving Average," which gives more importance to recent price data, making it more responsive to current market movements than a standard average.
- Short-Term Period: Tracks very recent price action (default set to 5 periods).
- Longer-Term Period: Tracks a slightly broader scope of price action (default set to 9 periods).
2. The Mathematical Calculation Rather than showing you the raw averages, the tool performs a specific calculation: it doubles the value of the short-term average and then subtracts the value of the longer-term average.
By performing this subtraction, the script isolates the "gap" or "divergence" between these two trends. This allows a trader to see the intensity of price movement. When the resulting line moves significantly in one direction, it indicates strong momentum; when the line flattens or reverses, it suggests that the trend may be losing steam or changing direction.
3. Visual Representation The result is displayed as a single red line on your trading chart. This line acts as a visual "pulse" of the market:
- Trend Strength: The higher the peak or lower the trough of the line, the more aggressive the current price movement.
- Trend Reversals: Sharp changes in the direction of this line can serve as early warning signals that the current trend is reaching an exhaustion point.
How it helps the user
By simplifying two complex moving averages into one single reactive line, this script helps you filter out "market noise." It allows you to focus on the velocity of price changes, making it easier to identify where a move is gaining strength and where it might be starting to fade.
//+------------------------------------------------------------------+
//|                                                          MA2.mq4 |
//+------------------------------------------------------------------+
#property copyright ""
#property link      ""

#property indicator_chart_window
#property indicator_buffers 1
#property indicator_color1 Red
//----
extern int MA1_Period=5;
extern int MA2_Period=9;
double ExtMapBuffer[];
int ExtCountedBars=0;
//+------------------------------------------------------------------+
int init()
{
   int draw_begin;
   SetIndexStyle(0,DRAW_LINE);
   IndicatorDigits(MarketInfo(Symbol(),MODE_DIGITS));
   draw_begin=MA2_Period-1;
   SetIndexDrawBegin(0,draw_begin);
   SetIndexBuffer(0,ExtMapBuffer);
   return(0);
}
//+------------------------------------------------------------------+
int start()
{
int i,pos=Bars-ExtCountedBars-1;
   if(Bars<=MA2_Period) return(0);
   ExtCountedBars=IndicatorCounted();
   if (ExtCountedBars<0) return(-1);
   if (ExtCountedBars>0) ExtCountedBars--;
   while(pos>=0)
   {
      ExtMapBuffer[pos]=2*iMA(NULL,0,MA1_Period,0,MODE_LWMA,PRICE_MEDIAN,pos)-iMA(NULL,0,MA2_Period,0,MODE_LWMA,PRICE_MEDIAN,pos);
      pos--;
   }
   return(0);
}
//+------------------------------------------------------------------+
Comments