lukas1 Arrows & Curves
Download script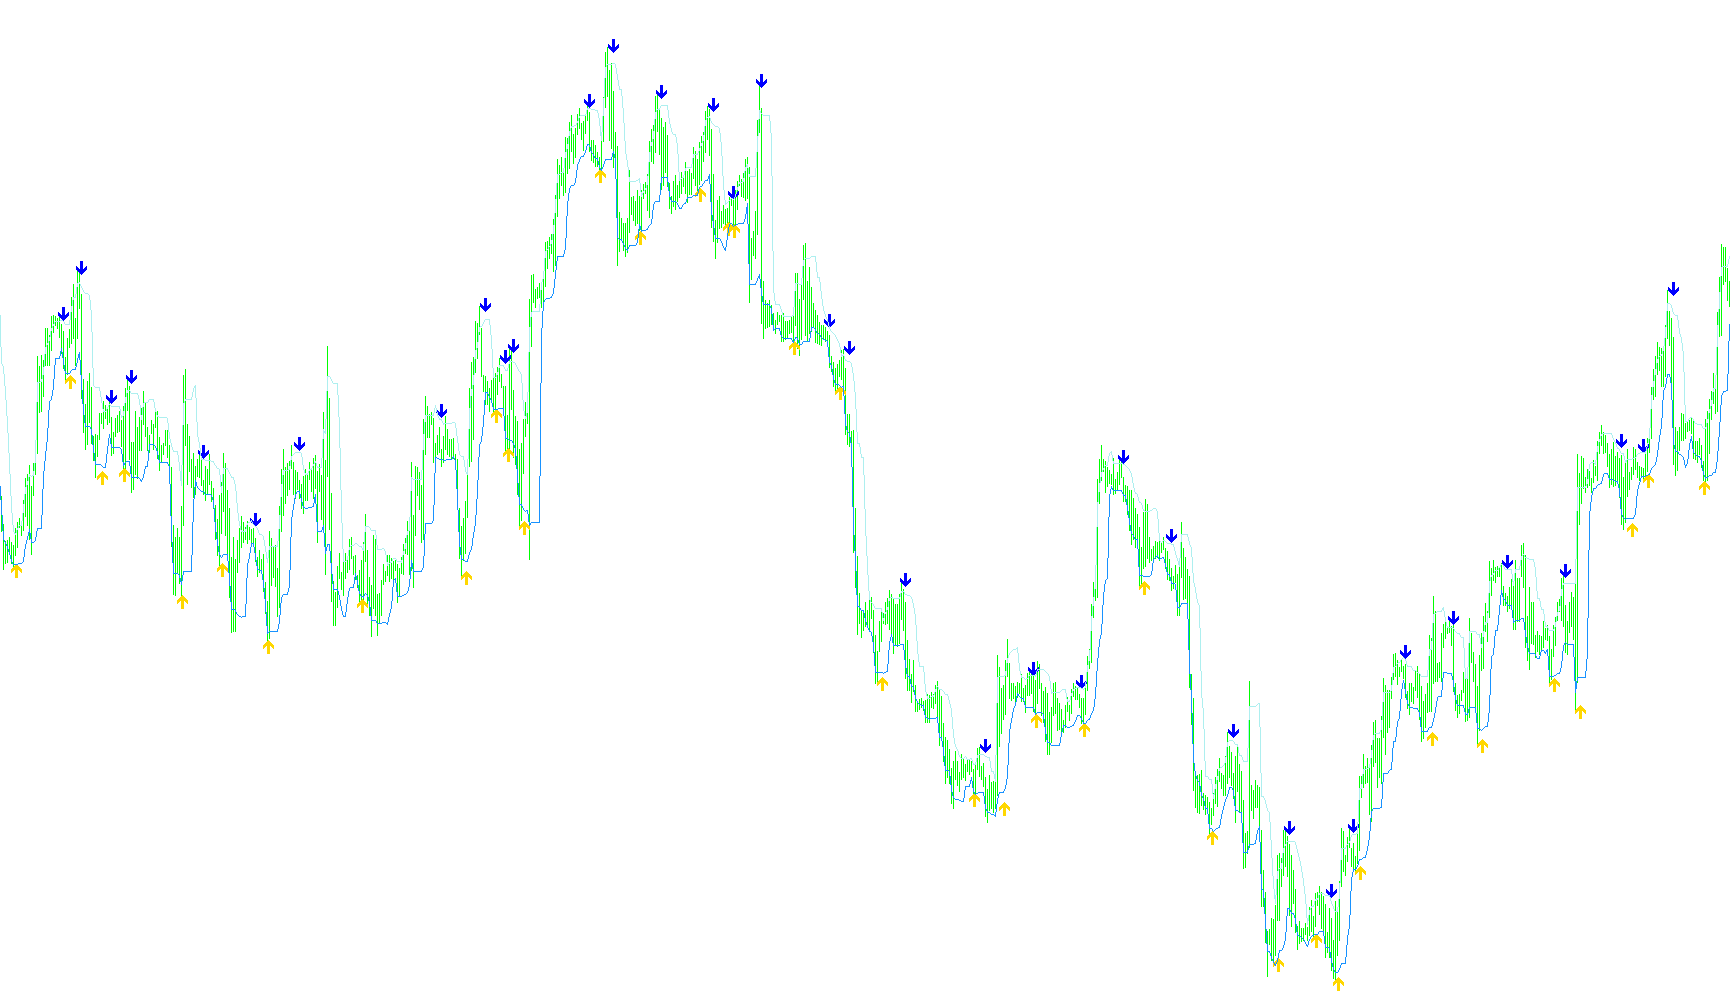
The "lukas1 arrows & curves" script is a technical analysis tool designed to identify potential trend shifts and price boundaries on a trading chart. It functions by establishing dynamic "ceiling" and "floor" levels based on recent price volatility, providing visual cues for where the market might be turning.
Core Logic and Mechanism
Dynamic Boundary Calculation The script constantly monitors a specific window of recent price history (defined by the "Period" settings). Within this window, it identifies the highest and lowest prices reached. It then calculates two dynamic lines:
- A High Boundary (Ceiling): A level set slightly below the recent peak.
- A Low Boundary (Floor): A level set slightly above the recent valley.
The distance between these boundaries is determined by a sensitivity percentage. This means the tool adapts to market volatility; when the market is moving aggressively, the boundaries widen, and when it isrange-bound, the boundaries tighten.
Trend Detection and Signaling The primary logic of the script relies on "breakout" behavior. It tracks whether the price is currently trending upwards or downwards by monitoring when the closing price crosses these calculated boundaries:
- Trend Flip: If the price closes above the high boundary, the internal logic recognizes an upward trend. If it closes below the low boundary, it recognizes a downward trend.
- Visual Signals: When the script detects a change in the trend direction (e.g., switching from an uptrend to a downtrend), it places visual markers on the chart. These markers serve as alerts for potential entry points or reversals.
Performance Optimization From a structural standpoint, the script is designed for efficiency. It processes all necessary mathematical calculations within a single execution cycle. This ensures that the tool provides real-time updates on the chart without causing significant lag or slowing down the trading platform's performance.
Key Features for the User
- Visual Curves: The script plots the high and low boundaries as continuous lines, allowing you to see the "channels" in which the price is currently moving.
- Automated Alerts: By using global variables, the script can internally flag specific buy or sell conditions when a trend reversal occurs at the most recent price candle.
- Customizable Sensitivity: Users can adjust the period of analysis and the percentage of the boundary gap to suit different trading styles, from fast-paced scalping to slower, long-term trend following.
//+------------------------------------------------------------------+
//|                      lukas1 arrows & curves.mq4       v.14       |
//|       Èçìåíåíèÿ:                                                 |
//|       1. Óáðàíû íåíóæíûå (ëèøíèå) êîýôôèöèåíû, íå ó÷àñòâóþùèå    |
//|          â ðàñ÷åòàõ Kmin, Kmax, RISK                             |
//|       2. Ìàòåìàòèêà èíäèêàòîðà âñå ðàñ÷åòû âûïîëíÿåò             |
//|          âíóòðè îäíîãî öèêëà, ýòî óâåëè÷èëî ñêîðîñòü îáñ÷¸òà.    |
//|       3. Âûêëþ÷åíî ìåðöàíèå ñòðåëîê.                             |
//+------------------------------------------------------------------+
#property copyright "Copyright © 2007, lukas1"
#property link      "http://www.alpari-idc.ru/"
//----
#property indicator_chart_window
#property indicator_buffers 4
#property indicator_color1 Blue
#property indicator_color2 Red
#property indicator_color3 Green
#property indicator_color4 Green
//---- input parameters
extern int SSP       = 6;     //ïåðèîä ëèíåéíîãî ðàçâîðîòà èíäèêàòîðà
extern int CountBars = 2250;  //ðàñ÷åòíûé ïåðèîä
extern int SkyCh     = 13;    //÷óâñòâèòåëüíîñòü ê ïðîáîþ êàíàëà
//Äîëæíà áûòü â äèàïàçîíå 0-50. 0 - íåò ñòðåëîê. Áîëüøå 50 - ïåðåðåãóëèðîâàíèå
int    i;
double high, low, smin, smax;
double val1[];      // áóôåð äëÿ áàé
double val2[];      // áóôåð äëÿ ñåëë
double Sky_BufferH[];
double Sky_BufferL[];
bool   uptrend, old;
//+------------------------------------------------------------------+
//| Custom indicator initialization function                         |
//+------------------------------------------------------------------+
int init()
  {
   SetIndexStyle(0, DRAW_ARROW);
   SetIndexArrow(0, 233);        // ñòðåëêà äëÿ áàé
   SetIndexBuffer(0, val1);      // èíäåêñ áóôåðà äëÿ áàé
   SetIndexDrawBegin(0, 2*SSP);
   //
   SetIndexStyle(1, DRAW_ARROW);
   SetIndexArrow(1, 234);        // ñòðåëêà äëÿ ñåëë
   SetIndexBuffer(1, val2);      // èíäåêñ áóôåðà äëÿ ñåëë
   SetIndexDrawBegin(1, 2*SSP);
   //
   SetIndexStyle(2, DRAW_LINE);
   SetIndexBuffer(2, Sky_BufferH);
   SetIndexLabel(2, "High");
   SetIndexDrawBegin(2, 2*SSP);
   //
   SetIndexStyle(3, DRAW_LINE);
   SetIndexBuffer(3, Sky_BufferL);
   SetIndexLabel(3, "Low");
   SetIndexDrawBegin(3, 2*SSP);
//----
   return(0);
  }
//+------------------------------------------------------------------+
//| Calculation of SilverTrend lines                                 |
//+------------------------------------------------------------------+
int start()
  {
   int counted_bars = IndicatorCounted();
//---- ïîñëåäíèé ïîñ÷èòàííûé áàð áóäåò ïåðåñ÷èòàí
   if(counted_bars > 0) counted_bars--;
//----
   if(Bars <= SSP + 1)        return(0);
//---- initial zero
   uptrend       =false;
   old           =false;
   GlobalVariableSet("goSELL", 0); // çàäàëè ñóùåñòâîâàíèå è îáíóëèëè goSELL=0
   GlobalVariableSet("goBUY", 0);  // çàäàëè ñóùåñòâîâàíèå è îáíóëèëè goBUY =0
//----
   for(i = CountBars - SSP; i >= 0; i--) // óìåíüø çíà÷åíèå shift íà 1 çà ïðîõîä;
     {
       high = High[iHighest(Symbol(),0,MODE_HIGH,SSP,i)];
       low = Low[iLowest(Symbol(),0,MODE_LOW,SSP,i)];
       smax = high - (high - low)*SkyCh / 100; // smax íèæå high ñ ó÷åòîì êîýôô.SkyCh
       smin = low + (high - low)*SkyCh / 100;  // smin âûøå low ñ ó÷åòîì êîýôô.SkyCh
	    val1[i] = 0;
       val2[i] = 0;
       if(Close[i] < smin && i!=0 )	// âûêëþ÷åíî ìåðöàíèå ñòðåëîê (i!=0)
       {
       uptrend = false;
       }
	    if(Close[i] > smax && i!=0 )	// âûêëþ÷åíî ìåðöàíèå ñòðåëîê (i!=0)
	    {
	    uptrend = true;
       }
       if(uptrend != old && uptrend == false)
         {
           val2[i] = high; // åñëè óñëîâèÿ âûïîëíåíû òî ðèñóåì val1
           if(i == 0)                GlobalVariableSet("goBUY",1);
         }
       if(uptrend != old && uptrend == true )
         {
           val1[i] = low; // åñëè óñëîâèÿ âûïîëíåíû òî ðèñóåì val2
           if(i == 0)                GlobalVariableSet("goSELL",1);
         }
       old=uptrend;
       Sky_BufferH[i]=high - (high - low)*SkyCh / 100;
       Sky_BufferL[i]=low +  (high - low)*SkyCh / 100;
     }
   return(0);
  }
//+------------------------------------------------------------------+
Comments