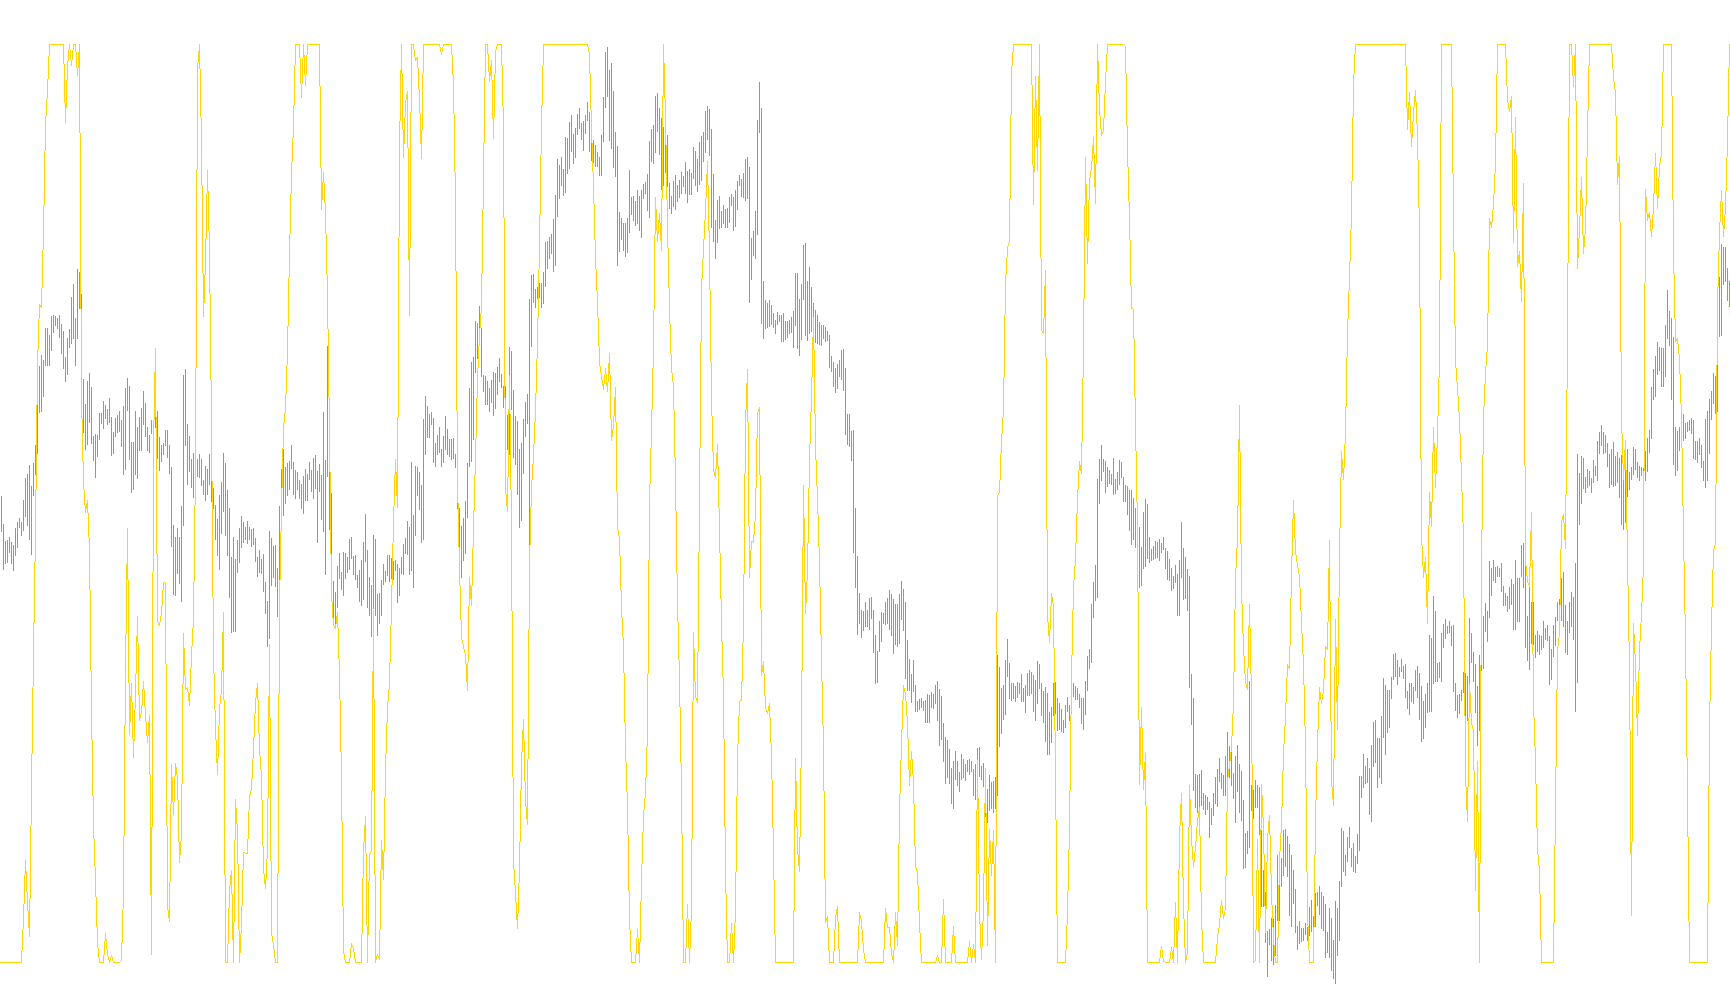
This tool is a specialized technical analysis indicator designed to help traders visualize market momentum and price velocity. Rather than simply tracking the current price, it uses a sophisticated mathematical approach to smooth out "market noise" and provide a clearer picture of whether an asset is trending upward or downward.
How it Works
The logic behind this script relies on a multi-layered calculation system that evaluates price movement through the following stages:
1. Smoothing the Price Data The indicator begins by processing historical closing prices using a specific smoothing factor (Gamma). Instead of reacting impulsively to every tiny fluctuation in the market, the script blends the current price with previous data points. This creates a series of "levels" that track the general flow of the market more reliably than raw price action alone.
2. Relative Velocity Calculation The core of the script involves comparing these smoothed levels against one another. It calculates the differences between four distinct layers of data. By examining how much these layers move in relation to each other, the tool can determine the "velocity" of the current price movement.
3. Determining Momentum Direction The script tracks two specific forces:
- Upward Momentum: It sums up all positive movements where higher levels are outperforming lower ones.
- Downward Momentum: It sums up all negative movements where lower levels are pulling away from the higher ones.
4. The Final Output By dividing the upward momentum by the total combined momentum, the indicator produces a percentage-style value. This value is displayed in a separate window on your chart.
What this means for the user
The resulting line represents the "momentum balance." When the value shifts toward the higher end of its range, it suggests that buying pressure is dominating the trend. Conversely, when it moves toward the lower end, it indicates that selling pressure is taking hold. By providing a smoothed representation of these forces, the indicator aims to help traders identify the strength of a trend and potential exhaustion points before they become obvious on the main price chart.
//+------------------------------------------------------------------+
//|                                                     Laguerre.mq4 |
//|                                                     Emerald King |
//|                                     mailto:info@emerald-king.com |
//+------------------------------------------------------------------+
#property copyright "Emerald King"
#property link      "mailto:info@emerald-king.com"

#property indicator_separate_window
#property indicator_color1 Magenta
#property indicator_level2 0.75
#property indicator_level3 0.45
#property indicator_level4 0.15
//---- input parameters
extern double gamma=0.7;
extern int CountBars=950;

double L0 = 0;
double L1 = 0;
double L2 = 0;
double L3 = 0;
double L0A = 0;
double L1A = 0;
double L2A = 0;
double L3A = 0;
double LRSI = 0;
double CU = 0;
double CD = 0;

double val1[];
//+------------------------------------------------------------------+
//| Custom indicator initialization function                         |
//+------------------------------------------------------------------+

int init()
  {
//---- indicators
//----
   SetIndexBuffer(0,val1);
   return(0);
  }
//+------------------------------------------------------------------+
//| Custor indicator deinitialization function                       |
//+------------------------------------------------------------------+
int deinit()
  {
//---- TODO: add your code here

//----
   return(0);
  }
//+------------------------------------------------------------------+
//| Custom indicator iteration function                              |
//+------------------------------------------------------------------+
int start()
  {
   if (CountBars>Bars) CountBars=Bars;
   SetIndexDrawBegin(0,Bars-CountBars);

   int i;
   int    counted_bars=IndicatorCounted();

   //if(CountBars<=Lookback) return(0);
   //---- initial zero
   //if(counted_bars<1)
   //{
   //   for(i=1;i<=Lookback;i++) val1[CountBars-i]=0.0;
   //}

   i=CountBars-1;
   while(i>=0)
   {
      L0A = L0;
      L1A = L1;
      L2A = L2;
      L3A = L3;
      L0 = (1 - gamma)*Close[i] + gamma*L0A;
      L1 = - gamma *L0 + L0A + gamma *L1A;
      L2 = - gamma *L1 + L1A + gamma *L2A;
      L3 = - gamma *L2 + L2A + gamma *L3A;

      CU = 0;
      CD = 0;

      if (L0 >= L1) CU = L0 - L1; else CD = L1 - L0;
      if (L1 >= L2) CU = CU + L1 - L2; else CD = CD + L2 - L1;
      if (L2 >= L3) CU = CU + L2 - L3; else CD = CD + L3 - L2;

      if (CU + CD != 0) LRSI = CU / (CU + CD);
      val1[i] = LRSI;
	  i--;
	}
   return(0);
 }
//+------------------------------------------------------------------+
Comments