MACD Crossover Arrows & Alert
Indicator

MACD Crossover Arrows & Alert

iMACD

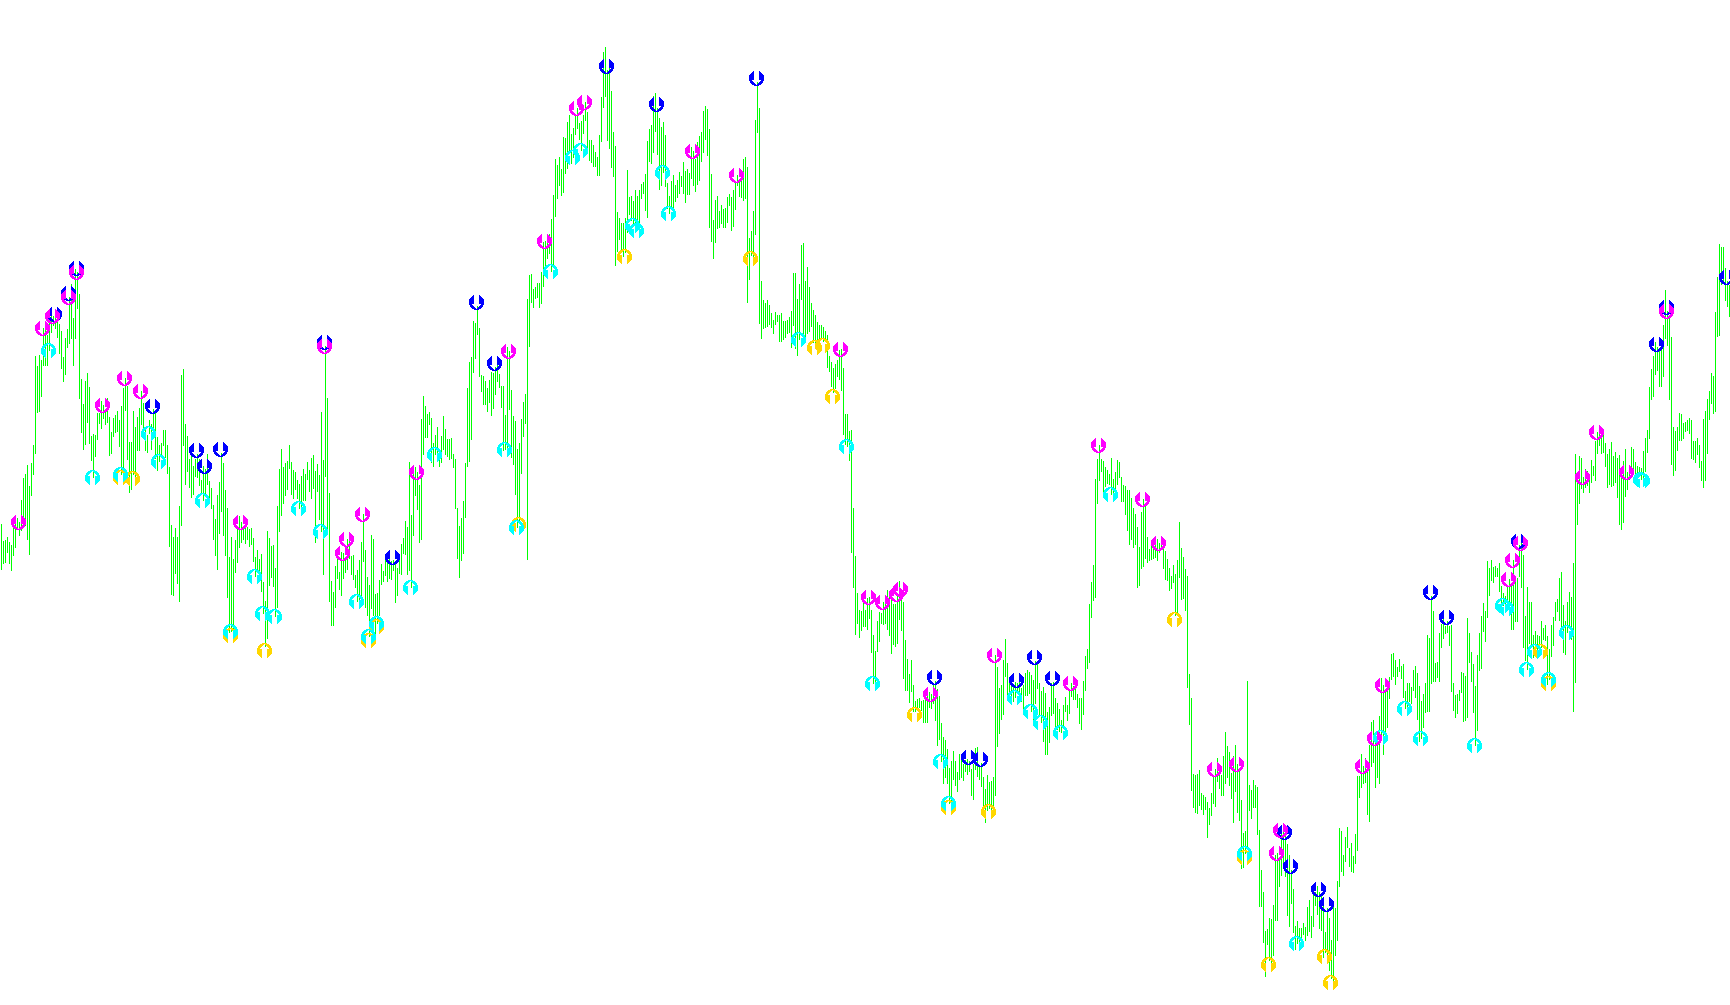
This indicator identifies momentum shifts by detecting specific bullish and bearish crossovers between the MACD main line and signal line, projecting visual markers and multi-channel notifications on new candles.

MACD Custom
Indicator

MACD Custom

iMAiMAOnArray

Calculates the variance between two exponential moving averages and overlays a simple moving average of that variance to identify momentum shifts.

MACD Dot
Indicator

MACD Dot

iMAiMAOnArray

This indicator identifies bullish and bearish momentum shifts by detecting precise crossings between the MACD line and its signal average, marking them with visual arrows.

MACD Fix
Indicator

MACD Fix

iMAiMAOnArray

This indicator calculates the divergence between two exponential moving averages and applies a weighted 1.3x multiplier to visualize momentum shifts via dual-colored histograms.

MACD Hist
Indicator

MACD Hist

iOsMAiMAiMAOnArray
Indicator

MACD HISTO

iOsMAiMAiMAOnArray
MACD Histogram WIS
Indicator

MACD Histogram WIS

iMAiMAOnArray

This indicator quantifies market momentum by correlating MACD histogram shifts with secondary moving average filters to validate directional trends.

MACD HISTO_001
Indicator

MACD HISTO_001

iMAiMAOnArray

The algorithm identifies directional momentum by calculating the delta between a dual-EMA spread and its subsequent smoothed signal average, visualized through polarized histogram bars.

MACD Hist_v1
Indicator

MACD Hist_v1

iOsMAiMAiMAOnArray
MACD line
Indicator

MACD line

iMAiMAOnArray

Quantifies price velocity by calculating the divergence between two distinct Exponential Moving Averages and smoothing the resulting differential via a Simple Moving Average.

MACD Non Meta bb
Indicator

MACD Non Meta bb

iMA

This indicator calculates the variance between two exponential moving averages to derive a momentum line, which is then smoothed by an alpha-weighted signal to visualize price velocity and trend crossovers.

Macd Support and Resistance
Indicator

Macd Support and Resistance

iMACD

This indicator identifies dynamic support and resistance zones by correlating MACD signal crossovers with price extremes to map structural trend reversals.

MACD trad
Indicator

MACD trad

iMAiMAOnArray

This indicator calculates the variance between two exponential moving averages and projects a secondary smoothed signal line to visualize momentum shifts through a scaled histogram.

MACD with crossing
Indicator

MACD with crossing

iMAiMAOnArray

Identifies bullish and bearish reversals by plotting visual markers at the precise intersection points of the MACD line and its signal average.

Indicator

MACD# MTF

iMACD
MACD&STOCH ON CHART DIVERGENCE
Indicator

MACD&STOCH ON CHART DIVERGENCE

iMACDiStochastic

This indicator identifies structural price-momentum discrepancies by detecting bullish and bearish divergences between price action and both MACD and Stochastic oscillators.

MACD+MA
Indicator

MACD+MA

iMACDiMA

The indicator identifies bullish and bearish trend shifts by detecting simultaneous upward or downward price momentum across both a Moving Average and the MACD Main line.

MACD+OsMA+BB
Indicator

MACD+OsMA+BB

This indicator synthesizes MACD momentum, Optimized Signal Moving Averages (OsMA), and Bollinger Band volatility dynamics to visualize trend reversals and price velocity.

MACD+OsMA
Indicator

MACD+OsMA

iOsMAiMAiMAOnArray
MACD+OsMA_v1
Indicator

MACD+OsMA_v1

iOsMAiMAiMAOnArray
Indicator

MacD-2 line

iMAiMAOnArray
MacD-2 line_v1
Indicator

MacD-2 line_v1

iMAiMAOnArray

This indicator calculates the divergence between two exponential moving averages to identify momentum shifts while applying a simple moving average filter to generate a trailing signal line.

Indicator

MacD-2 line_v2

iMAiMAOnArray
MACD-2
Indicator

MACD-2

iMAiMAOnArray

This indicator calculates the differential between fast and slow exponential moving averages to generate a directional momentum histogram that shifts color based on the trend's velocity change.

Indicator

MACD-2_MTF

Indicator

MACD-2_MTF_v1

MACD-2_v1
Indicator

MACD-2_v1

iMAiMAOnArray

This indicator calculates the spread between two exponential moving averages and applies a secondary signal smoothing to generate amplified directional histograms.

MACD-2_v2
Indicator

MACD-2_v2

iMAiMAOnArray

This indicator calculates the spread between a fast and slow exponential moving average to generate a momentum histogram that shifts polarity based on directional velocity changes.

MACD-2_v3
Indicator

MACD-2_v3

iMAiMAOnArray

This indicator calculates the differential between exponential moving averages to project a tripled magnitude histogram that switches polarity based on trend acceleration.

MACD-2_v4
Indicator

MACD-2_v4

iMAiMAOnArray

This indicator identifies trend reversals by calculating the differential between accelerated and decelerated exponential moving averages, highlighting momentum shifts through multi-buffer histogram visualization.

MACD-4H+
Indicator

MACD-4H+

iMACD

This indicator projects the Moving Average Convergence Divergence values from a higher timeframe onto the current chart to facilitate trend alignment.

MACD-4H-v10
Indicator

MACD-4H-v10

iMACD

This indicator projects high-timeframe MACD momentum dynamics onto the current chart by synchronizing historical bar data from a larger period.

MACD-Alt
Indicator

MACD-Alt

iMAiMAOnArray

This indicator calculates the differential between two exponential moving averages and overlays a simple moving average signal line to identify momentum shifts.

MACD-Crossover_Signal
Indicator

MACD-Crossover_Signal

iMACD

This indicator identifies bullish and bearish trend shifts by detecting specific intersection points between the MACD main line and its signal line, adjusted by historical volatility ranges.

macd-dot
Indicator

macd-dot

iMAiMAOnArray

This indicator identifies bullish and bearish reversal points by detecting the precise moment when the MACD line crosses above or below its signal average.

macd-dot_001
Indicator

macd-dot_001

iMAiMAOnArray

This indicator identifies bullish and bearish entry points by detecting instantaneous trend reversals when the MACD line intersects its signal line.

MACD-OsMA(AM).3
Indicator

MACD-OsMA(AM).3

iMAiMAOnArray

This indicator identifies trend transitions by visualizing the directional momentum of both the raw MACD line and its signal variance through comparative histogram peaks.

MACD-Silver
Indicator

MACD-Silver

iMA

This indicator visualizes the differential between two exponential moving averages as a dynamic histogram that switches colors based on consecutive value thresholds.

MACD
Indicator

MACD

iMAiMAOnArray

This indicator calculates the instantaneous difference between two exponential moving averages and overlays a smoothed simple moving average signal line to identify trend shifts.

MacdACSignals
Indicator

MacdACSignals

iACiMACD

This indicator identifies high-probability entry points by detecting simultaneous bullish or bearish trend shifts in the MACD oscillator combined with specific multi-bar sequential price action patterns from the Awesome Oscillator.

MACDBars
Indicator

MACDBars

iMACD

This indicator visualizes bullish and bearish zones by comparing the MACD main line against its signal line across customizable timeframes and price types.

MACDdtLSMA
Indicator

MACDdtLSMA

This indicator calculates the momentum of price action by determining the difference between a fast and slow Least Squares Moving Average (LSMA) and plotting the resulting signal line and histogram.

MACDdtLSMA_BC
Indicator

MACDdtLSMA_BC

This indicator calculates the momentum difference between two Least Squares Moving Averages and applies an exponential smoothing signal to generate dynamic bar colorization based on histogram polarity.

MACDdtLSMA_v1
Indicator

MACDdtLSMA_v1

This indicator calculates momentum by determining the difference between two Least Squares Moving Averages and overlaying a smoothed signal line to identify trend reversals.

macdHelp
Indicator

macdHelp

iOsMAiMAiMAOnArray
MACDmVersion2_MOD
Indicator

MACDmVersion2_MOD

iMAiMAOnArray

This indicator calculates the differential between two exponential moving averages and overlays a smoothed signal line with color-coded histogram bars to visualize bullish and bearish momentum shifts.

MACDonRSI
Indicator

MACDonRSI

iMAiMAOnArrayiRSIOnArray

This indicator computes a derivative momentum signal by applying an RSI calculation onto a smoothed Moving Average, followed by a MACD-style difference of dual EMAs.

MACDsignals
Indicator

MACDsignals

iMAiMAOnArray

This indicator identifies trend reversal points by analyzing specific multi-bar price velocity changes and relative momentum shifts within the MACD histogram.

MACDsignalsv0.2
Indicator

MACDsignalsv0.2

iMAiMAOnArray

This indicator identifies bullish and bearish reversals by analyzing specific geometric shifts in MACD histogram velocity relative to multi-bar price action volatility.

MACDTrad
Indicator

MACDTrad

iMAiMAOnArray

This technical indicator quantifies the variance between two exponential moving averages to visualize trend velocity through a dual-line crossover and a dynamic differential histogram.