LSMA_ind_06
Download script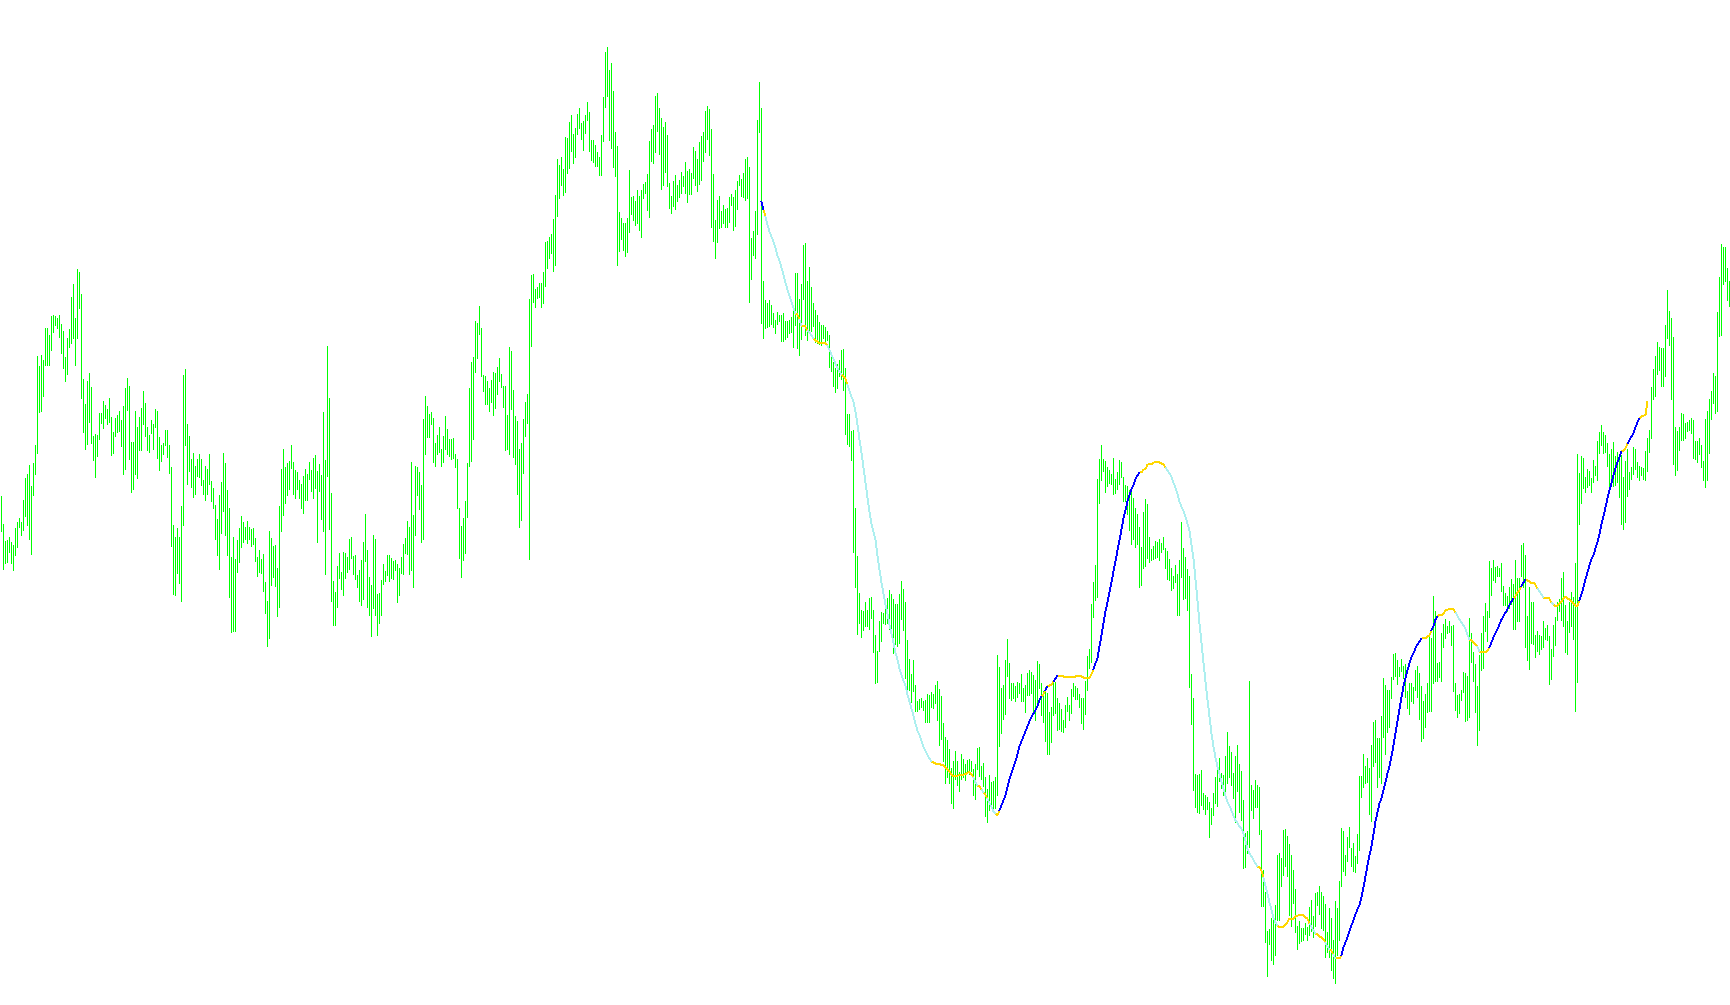
This tool is designed as a visual technical indicator for trading charts, specifically created to help identify trends and price momentum. Rather than simply showing raw price action, it processes historical data to create smoothed trend lines that filter out minor market "noise."
How the Logic Works
The core logic of this script relies on a weighted mathematical calculation. Instead of treating every price point equally, the indicator looks back over a specific period of time (defined by the user settings) and assigns different levels of importance to various prices within that window. This creates a "weighted" average that is more responsive to significant moves while remaining smooth enough to ignore insignificant fluctuations.
Visual Representation
The tool generates three distinct visual components on the chart:
- The Base Line: The primary calculation produces a steady moving line that represents the overall direction of the market trend.
- Dynamic Color Signaling: The indicator uses a logic gate to decide when to display specific colors (Yellow, Green, and Red). These colors are triggered based on the relationship between the current trend value and its previous state.
- Momentum Filtering: The script includes a "Difference" threshold. This means that small, minor wobbles in price won't trigger a change in the visual signal. The indicator only recognizes a shift if the movement exceeds a specific predetermined distance. If the price movement is too subtle, the tool keeps the signals hidden to prevent confusion.
Practical Application
For a user viewing the chart, this logic translates into a visual "filter." By looking at where the lines appear and disappear:
- It helps identify whether the current momentum is moving upward or downward relative to its recent history.
- By suppressing colors during low-volatility periods (where the change is less than the "Difference" setting), it helps traders focus only on significant trend shifts that meet a specific magnitude of movement.
In summary, this script acts as a sophisticated smoothing tool that mathematically balances historical price data to provide a clearer picture of market direction.
//+------------------------------------------------------------------+
//| LSMA                                                             |
//+------------------------------------------------------------------+
#property  copyright "Copywrong 2005 RonT"
#property  link      "http://www.lightpatch.com/forex/"

//---- indicator settings
#property  indicator_chart_window

#property indicator_buffers   7
#property indicator_color1  Yellow
#property indicator_color2  Green
#property indicator_color3  Red


//---- buffers
double ExtMapBuffer1[];  //Yellow
double ExtMapBuffer2[];  //Green
double ExtMapBuffer3[];  //Red

extern int extRperiod = 57;
extern int extDiff    =  6;
extern int extDraw4HowLong = 500;

int bartime;

//+------------------------------------------------------------------+
//| Custom indicator initialization function                         |
//+------------------------------------------------------------------+
int init()
  {

   SetIndexBuffer(0,ExtMapBuffer1);   //Yellow
   SetIndexStyle(0, DRAW_LINE, STYLE_SOLID, 2);

   SetIndexBuffer(1,ExtMapBuffer2);  //Green
   SetIndexStyle(1, DRAW_LINE, STYLE_SOLID, 2);

   SetIndexBuffer(2,ExtMapBuffer3);  //Red
   SetIndexStyle(2, DRAW_LINE, STYLE_SOLID, 2);

  }

//+------------------------------------------------------------------+
//| Custor indicator deinitialization function                       |
//+------------------------------------------------------------------+
int deinit()
  {
   int i;
   for( i=0; i<Bars; i++ )
     {
      ExtMapBuffer1[i]=0;
      ExtMapBuffer2[i]=0;
      ExtMapBuffer3[i]=0;
     }
  }


int start()
  {


   int    c;
   int    i;

   int    length;
   double lengthvar;
   int    loopbegin;

   int    pos;
   double sum;
   double tmp;

   double wtp; //previous value
   double wt;  //current value

   int DiffADJ=extDiff;

   if(bartime==Time[0]) return(0);
   bartime=Time[0];


   length = extRperiod;
   loopbegin = extDraw4HowLong - length - 1;

   for(pos = loopbegin; pos >= 0; pos--)
     {

      sum = 0;
      for(i = length; i >= 1  ; i--)
        {
         lengthvar = length + 1;
         lengthvar /= 3;
         tmp = 0;
         tmp = ( i - lengthvar)*NormalizeDouble(Open[length-i+pos],4);
         sum+=tmp;
        }

      wtp=wt;
      wt = sum*6/(length*(length+1));

      ExtMapBuffer1[pos] = wt+(10*Point);   //yellow
      ExtMapBuffer2[pos] = wt+(10*Point);   //green
      ExtMapBuffer3[pos] = wt+(10*Point);   //red

      if (wtp < wt+(DiffADJ*Point))
        {
         ExtMapBuffer3[pos] = EMPTY_VALUE; //remove RED
         //DiffADJ=0;
        }

      if (wtp > wt-(DiffADJ*Point))
        {
         ExtMapBuffer2[pos] = EMPTY_VALUE; //remove GREEN
         //DiffADJ=0;
        }

     if (wtp>wt+(DiffADJ*Point) && wtp<wt-(DiffADJ*Point))
       {
        //DiffADJ=extDiff;
       }

     }

  }
Comments