MA Chanels FIBO
Download script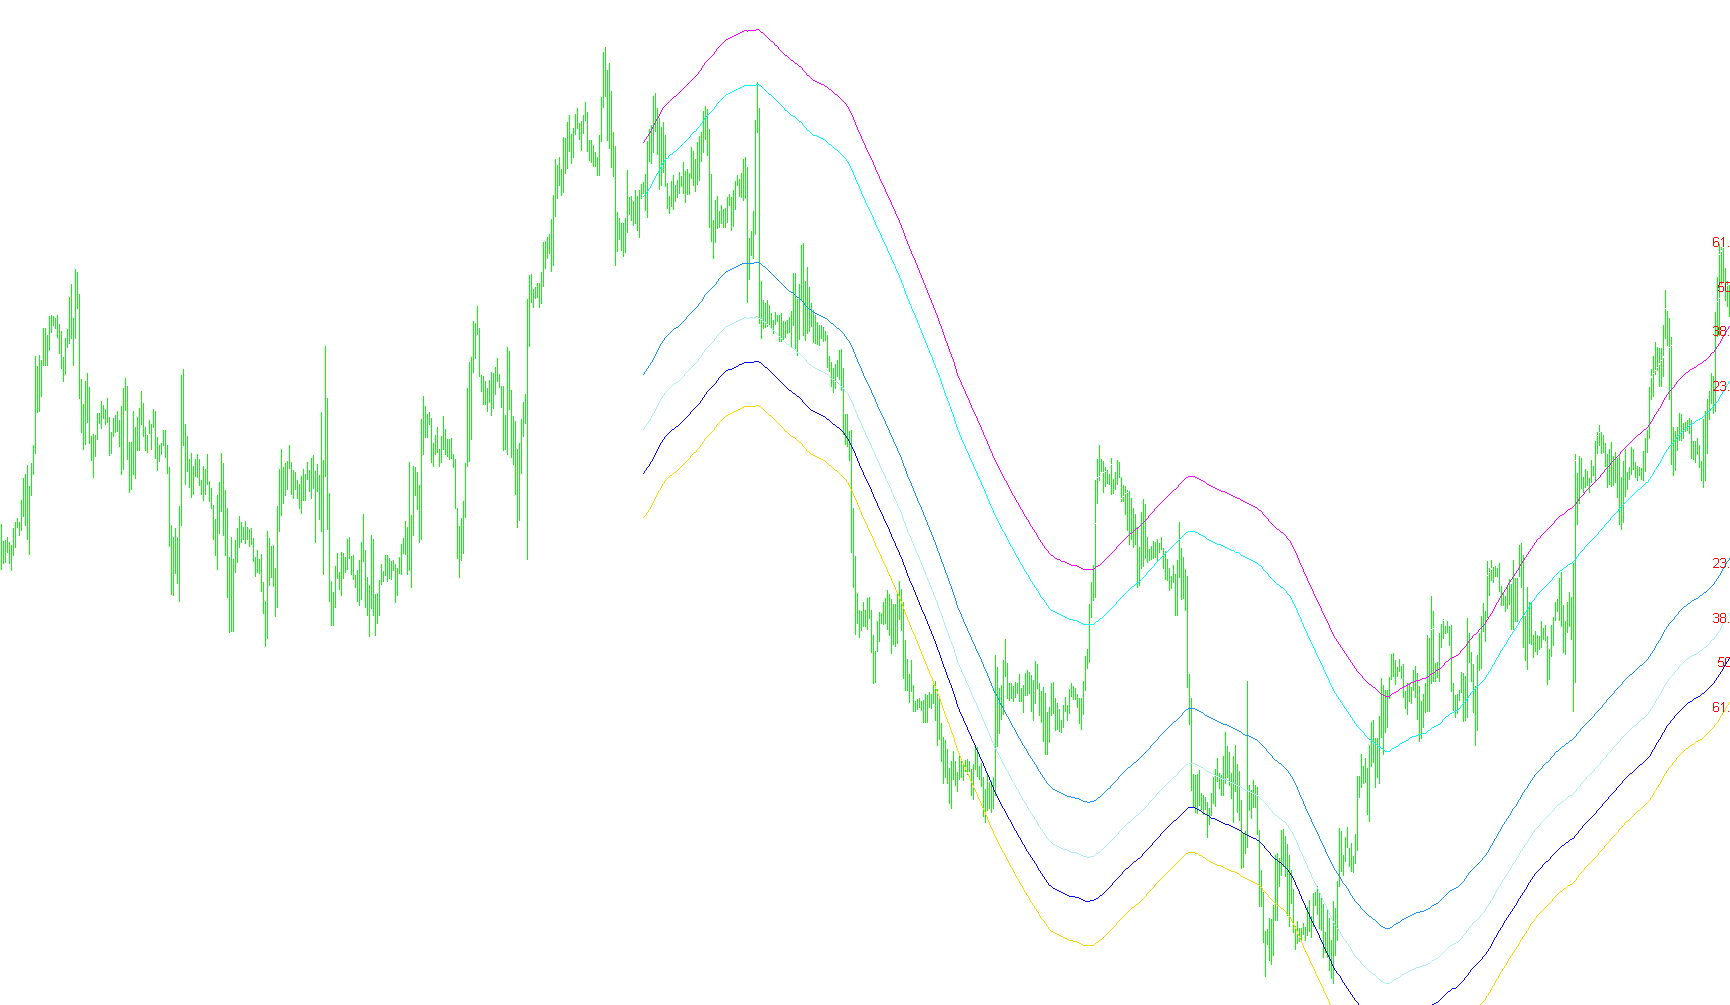
This tool is designed to provide visual guidance for traders by identifying potential support and resistance levels based on historical price volatility. It combines the use of a Moving Average (MA) with "Fibonacci" proportions to create a dynamic channel on your trading chart.
Core Logic Overview
The script operates through a three-step process: analyzing history, calculating proportions, and projecting visual lines.
1. Historical Volatility Analysis Instead of looking at fixed price points, the tool first scans a specific number of historical bars (defined by the user) to determine the market's "reach." It calculates the distance between the highest and lowest prices relative to a Moving Average. By identifying these extremes, the script establishes the primary range of price movement over a set period.
2. Fibonacci Scaling Once the maximum volatility (range) is identified, the script applies mathematical constants known as Fibonacci ratios (specifically 23.6%, 38.2%, 50%, and 61.8%). These are used to divide that price range into equal proportions. This helps in identifying "harmonic" levels where prices historically tend to react, slow down, or reverse.
3. Dynamic Channel Projection The final step involves drawing eight distinct lines on the chart simultaneously:
- The tool takes the current Moving Average value as a baseline.
- It adds and subtracts the calculated Fibonacci increments from this baseline.
- This results in a symmetrical "channel" or "envelope" surrounding the Moving Average.
Visual Output
As the price moves, these eight lines update in real-time. They appear as a series of bands that expand or contract based on recent market volatility:
- Outer Bands: Represent the broader 61.8% extremes.
- Middle Bands: Represent the 50% equilibrium point.
- Inner Bands: Represent the tighter 23.6% zones.
By observing where the current price interacts with these bands, traders can better visualize the "elasticity" of the market and identify areas where price might be overextended or finding significant support.
//+------------------------------------------------------------------+
//|                                                   MA Chanels.mq4 |
//|                                                           °njel° |
//|                                                     iamnotlinked |
//+------------------------------------------------------------------+
#property copyright "°njel°"
#property link      "iamnotlinked"

#property indicator_chart_window
#property indicator_buffers 8

#property indicator_color1 Red
#property indicator_color2 Orange
#property indicator_color3 Yellow
#property indicator_color4 White
#property indicator_color5 White
#property indicator_color6 Yellow
#property indicator_color7 Orange
#property indicator_color8 Red
//---- input parameters
extern int     BarsCount = 500;
extern int     MAPeriod=100;
extern int     MAMethod=MODE_SMA;
extern int     MAPrice=PRICE_CLOSE;
extern int     fontsize=10;
double  max =0;
double  min =0;

double    Inc0 = 0.0000;
double    Inc1 = 0.0000;
double    Inc2 = 0.0000;
double    Inc3 = 0.0000;
//---- buffers
double ExtMapBuffer1[];
double ExtMapBuffer2[];
double ExtMapBuffer3[];
double ExtMapBuffer4[];
double ExtMapBuffer5[];
double ExtMapBuffer6[];
double ExtMapBuffer7[];
double ExtMapBuffer8[];
//+------------------------------------------------------------------+
//| Custom indicator initialization function                         |
//+------------------------------------------------------------------+
int init()
  {
   SetIndexStyle(0,DRAW_LINE);
   SetIndexBuffer(0,ExtMapBuffer1);
   SetIndexLabel(0,"61.8%");
   SetIndexStyle(1,DRAW_LINE);
   SetIndexBuffer(1,ExtMapBuffer2);
   SetIndexLabel(1,"50%");
   SetIndexStyle(2,DRAW_LINE);
   SetIndexBuffer(2,ExtMapBuffer3);
   SetIndexLabel(2,"38.2%");
   SetIndexStyle(3,DRAW_LINE);
   SetIndexBuffer(3,ExtMapBuffer4);
   SetIndexLabel(3,"23.5%");
   SetIndexStyle(4,DRAW_LINE);
   SetIndexBuffer(4,ExtMapBuffer5);
   SetIndexLabel(4,"23.5%");
   SetIndexStyle(5,DRAW_LINE);
   SetIndexBuffer(5,ExtMapBuffer6);
   SetIndexLabel(5,"38.2%");
   SetIndexStyle(6,DRAW_LINE);
   SetIndexBuffer(6,ExtMapBuffer7);
   SetIndexLabel(6,"50%");
   SetIndexStyle(7,DRAW_LINE);
   SetIndexBuffer(7,ExtMapBuffer8);
   SetIndexLabel(7,"61.8%");
   ObjectCreate("l1", OBJ_TEXT, 0, 0, 0);
   ObjectSetText("l1", "61.8%",fontsize,"Arial",Red);
   ObjectCreate("l2", OBJ_TEXT, 0, 0, 0);
   ObjectSetText("l2", "50%",fontsize,"Arial",Red);
   ObjectCreate("l3", OBJ_TEXT, 0, 0, 0);
   ObjectSetText("l3", "38.2%",fontsize,"Arial",Red);
   ObjectCreate("l4", OBJ_TEXT, 0, 0, 0);
   ObjectSetText("l4", "23.5%",fontsize,"Arial",Red);
   ObjectCreate("l5", OBJ_TEXT, 0, 0, 0);
   ObjectSetText("l5", "23.5%",fontsize,"Arial",Red);
   ObjectCreate("l6", OBJ_TEXT, 0, 0, 0);
   ObjectSetText("l6", "38.2%",fontsize,"Arial",Red);
   ObjectCreate("l7", OBJ_TEXT, 0, 0, 0);
   ObjectSetText("l7", "50%",fontsize,"Arial",Red);
   ObjectCreate("l8", OBJ_TEXT, 0, 0, 0);
   ObjectSetText("l8", "61.8%",fontsize,"Arial",Red);
   return(0);
  }
//+------------------------------------------------------------------+
//| Custom indicator deinitialization function                       |
//+------------------------------------------------------------------+
int deinit()
  {
   max =0;
   min =0;
   ObjectDelete("l1");
   ObjectDelete("l2");
   ObjectDelete("l3");
   ObjectDelete("l4");
   ObjectDelete("l5");
   ObjectDelete("l6");
   ObjectDelete("l7");
   ObjectDelete("l8");
   return(0);
  }
//+------------------------------------------------------------------+
//| Custom indicator iteration function                              |
//+------------------------------------------------------------------+
int start()
  {


   max =0;
   min =0;


   if (iBars(NULL,0) < BarsCount)
      BarsCount = iBars(NULL,0) -MAPeriod-1 ;

   for (int i =BarsCount; i>=0; i--)
   {

      double m = iMA(NULL,0,MAPeriod,0,MAMethod,MAPrice,i);
      double top = High[i] - m;
      if (top > max)
         max = top;

      double bottom = Low[i] - m;
      if (bottom < min)
         min = bottom;

   }

   if (MathAbs(max) >  MathAbs(min))
      Inc3 = max;
   else
      Inc3 = min;


      Inc2 = Inc3*0.618;
      Inc1 = Inc3*0.5;
      Inc0 = Inc3*0.236;
      Inc3 = Inc3*0.382;


   for (i =BarsCount; i>=0; i--)
   {
      ExtMapBuffer1[i] = iMA(NULL,0,MAPeriod,0,MAMethod,MAPrice,i) + Inc2;
      ExtMapBuffer2[i] = iMA(NULL,0,MAPeriod,0,MAMethod,MAPrice,i) + Inc1;
      ExtMapBuffer3[i] = iMA(NULL,0,MAPeriod,0,MAMethod,MAPrice,i) + Inc3;
      ExtMapBuffer4[i] = iMA(NULL,0,MAPeriod,0,MAMethod,MAPrice,i) + Inc0;
      ExtMapBuffer5[i] = iMA(NULL,0,MAPeriod,0,MAMethod,MAPrice,i) - Inc0;
      ExtMapBuffer6[i] = iMA(NULL,0,MAPeriod,0,MAMethod,MAPrice,i) - Inc3;
      ExtMapBuffer7[i] = iMA(NULL,0,MAPeriod,0,MAMethod,MAPrice,i) - Inc1;
      ExtMapBuffer8[i] = iMA(NULL,0,MAPeriod,0,MAMethod,MAPrice,i) - Inc2;
   }
   ObjectMove("l1", 0, Time[0],ExtMapBuffer1[0]);
   ObjectMove("l2", 0, Time[0],ExtMapBuffer2[0]);
   ObjectMove("l3", 0, Time[0],ExtMapBuffer3[0]);
   ObjectMove("l4", 0, Time[0],ExtMapBuffer4[0]);
   ObjectMove("l5", 0, Time[0],ExtMapBuffer5[0]);
   ObjectMove("l6", 0, Time[0],ExtMapBuffer6[0]);
   ObjectMove("l7", 0, Time[0],ExtMapBuffer7[0]);
   ObjectMove("l8", 0, Time[0],ExtMapBuffer8[0]);
   return(0);
}
//+------------------------------------------------------------------+
Comments