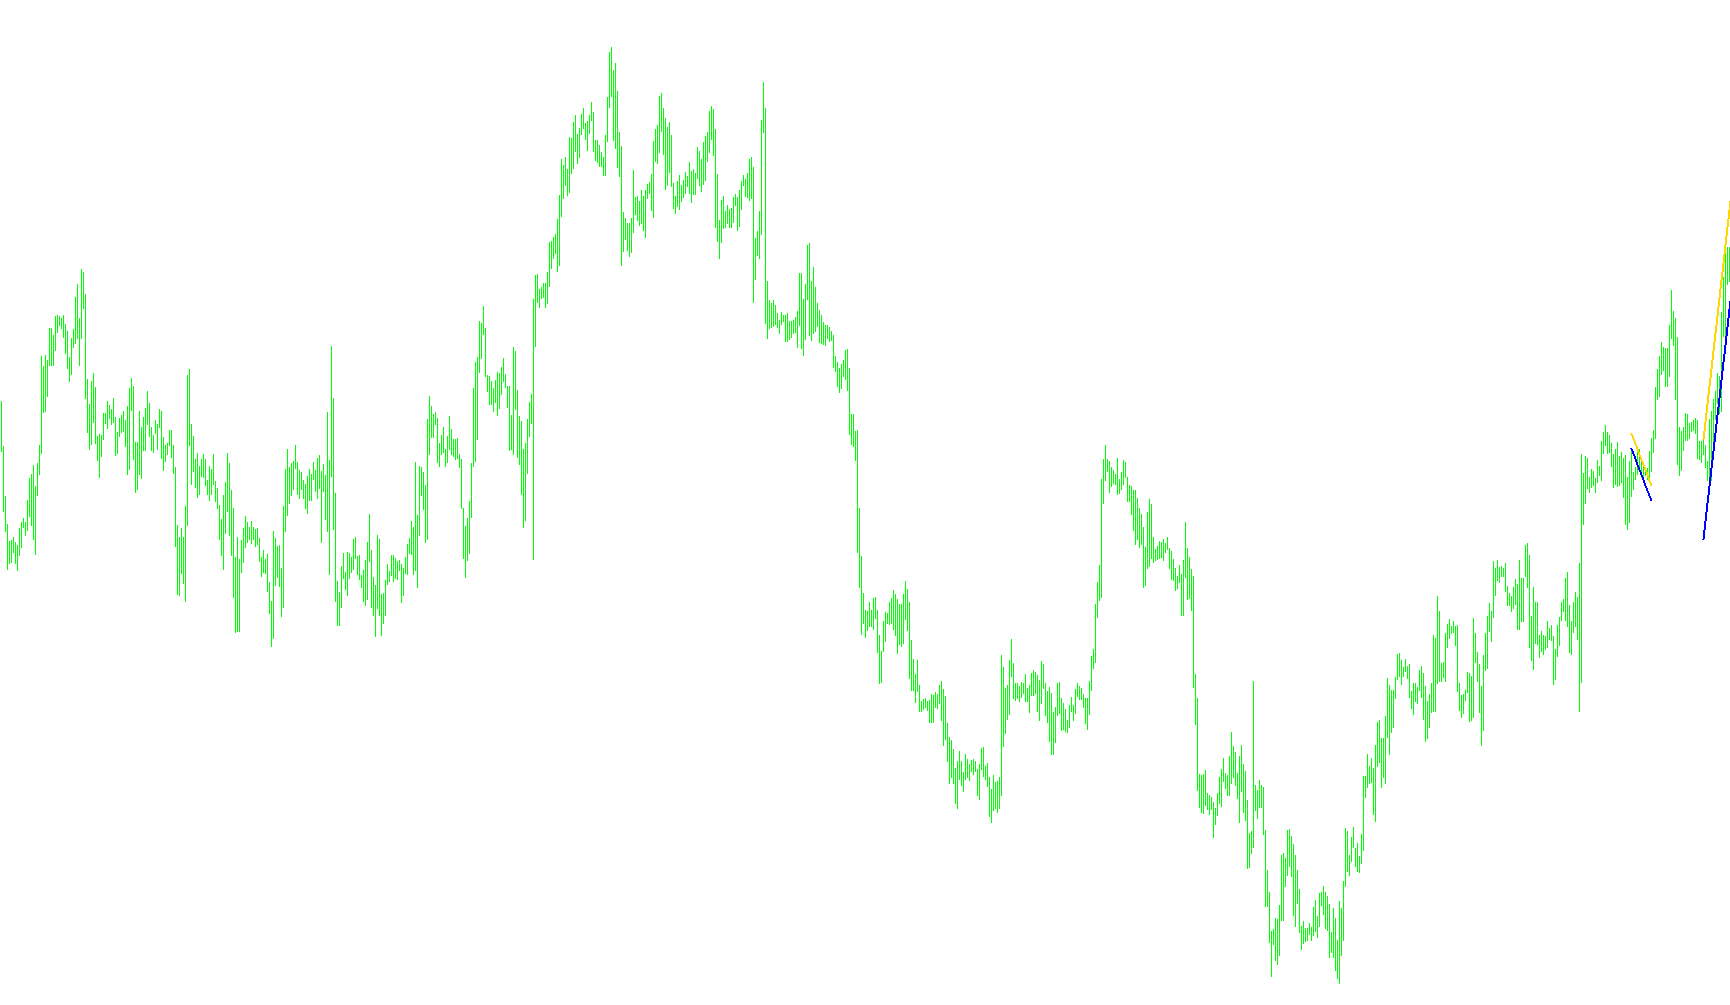
This script is a specialized technical analysis tool designed to identify and project trend boundaries on a trading chart. It focuses on identifying significant structural "peaks" and "valleys" in price action to help traders visualize potential support and resistance zones.
Core Logic Overview
The tool operates by identifying specific high and low points in the market, known as "Fractals." Instead of simply drawing static horizontal lines, it uses these points to calculate mathematical trajectories (linear equations) that project forward into the future.
1. Identification of Key Points
The script scans the historical price data to find the most recent significant structural points. It specifically looks for:
- Highs: Significant peaks where the price reversed downward.
- Lows: Significant valleys where the price reversed upward.
It continuously searches backward through time until it captures three distinct coordinates, providing a foundation for its calculations.
2. Trend Line Calculation
Once the key points are identified, the script performs a series of geometric calculations:
- Dynamic Projections: It uses these points to create two primary paths: an upper boundary and a lower boundary.
- Linear Equations: By applying a linear equation formula, the script determines the "path" the price should follow based on its recent structural behavior.
- Spacing Adjustments: The logic includes a configurable offset, allowing users to manually adjust how far above or below the calculated lines the boundaries appear on the screen.
3. Visual Representation
The final output is rendered on the trading chart in two ways:
- Dynamic Buffers: Two colored lines (SkyBlue and Salmon) are drawn on the chart. These represent the projected upper and lower limits based on the identified price structures.
- Extended Rays: If enabled, the script draws dotted "rays" that extend from the historical structural point toward the current price. This provides a clear visual of where the boundary originated and how it is expected to behave moving forward.
Summary for the User
In essence, this tool automates the process of identifying "swing highs" and "swing lows" and then draws mathematical projections from those points. It helps traders see potential price corridors—essentially suggesting where the market might face resistance (the upper line) or find support (the lower line) based on the geometry of recent price movements.
//+------------------------------------------------------------------+
//|                                                      i-SKB-F.mq4 |
//|                                           Êèì Èãîðü Â. aka KimIV |
//|                                              http://www.kimiv.ru |
//|                                                                  |
//|  13.06.2006  Ñêîëüçÿùèå êàíàëû Áàðèøïîëüöà íà Ôðàêòàëàõ.         |
//+------------------------------------------------------------------+
#property copyright "Êèì Èãîðü Â. aka KimIV"
#property link      "http://www.kimiv.ru"

#property indicator_chart_window
#property indicator_buffers 2
#property indicator_color1 SkyBlue
#property indicator_color2 Salmon

//------- Ïîêëþ÷åíèå âíåøíèõ ìîäóëåé ---------------------------------
//#include <.mqh>

//------- Âíåøíèå ïàðàìåòðû èíäèêàòîðà -------------------------------
extern int  FixedTF = 60;
extern int  OffSet  = -3;
extern bool ShowRay = True;

//------- Ãëîáàëüíûå ïåðåìåííûå èíäèêàòîðà ---------------------------
double dBuf0[];
double dBuf1[];


//+------------------------------------------------------------------+
//| Custom indicator initialization function                         |
//+------------------------------------------------------------------+
void init() {
  if (ShowRay) {
    ObjectCreate("HL", OBJ_TREND, 0, 0,0,0,0);
    ObjectCreate("LL", OBJ_TREND, 0, 0,0,0,0);
  }
  SetIndexBuffer(0, dBuf0);
  SetIndexLabel (0, "HL");
  SetIndexStyle (0, DRAW_LINE, STYLE_SOLID, 2);
  SetIndexBuffer(1, dBuf1);
  SetIndexLabel (1, "LL");
  SetIndexStyle (1, DRAW_LINE, STYLE_SOLID, 2);
}

//+------------------------------------------------------------------+
//| Custom indicator deinitialization function                       |
//+------------------------------------------------------------------+
void deinit() {
  ObjectDelete("HL");
  ObjectDelete("LL");
}

//+------------------------------------------------------------------+
//| Custom indicator iteration function                              |
//+------------------------------------------------------------------+
void start() {
  double y3=0, y2=0, y1=0, zz;    // ôðàêòàëû
  double y4, u2, u1, d2, d1;      // öåíîâûå óðîâíè ëèíèé
  int    x3, x2, x1, sh=2;        // íîìåðà áàðîâ
  string sL1, sL2;
  color  clU, clD;

  // Áåð¸ì òðè ýêñòðåìóìà Çèã-Çàãà
  while (y3==0) {
    zz=iFractals(NULL, FixedTF, MODE_UPPER, sh);
    if (zz==0) zz=iFractals(NULL, FixedTF, MODE_LOWER, sh);
    if (zz!=0) {
      if      (y1==0) { x1=sh; y1=zz; }
      else if (y2==0) { x2=sh; y2=zz; }
      else if (y3==0) { x3=sh; y3=zz; }
    }
    sh++;
  }

  y4=EquationDirect(x3, y3, x1, y1, x2);
  if (y2>y1) {
    u2=y3+y2-y4;
    u1=EquationDirect(x3, u2, x2, y2, 0);
    d2=y3;
    d1=EquationDirect(x3, y3, x1, y1, 0);
  } else {
    u2=y3;
    u1=EquationDirect(x3, y3, x1, y1, 0);
    d2=y3+y2-y4;
    d1=EquationDirect(x3, d2, x2, y2, 0);
  }

  u2+=OffSet*Point; u1+=OffSet*Point;
  d2-=OffSet*Point; d1-=OffSet*Point;

  x2=iBarShift(NULL, 0, iTime(NULL, FixedTF, x3));
  for (sh=x2; sh>=0; sh--) {
    dBuf0[sh]=EquationDirect(x2, u2, 0, u1, sh);
    dBuf1[sh]=EquationDirect(x2, d2, 0, d1, sh);
  }

  if (ShowRay) {
    ObjectSet("HL", OBJPROP_TIME1 , iTime(NULL, FixedTF, x3));
    ObjectSet("HL", OBJPROP_TIME2 , Time[0]);
    ObjectSet("HL", OBJPROP_PRICE1, u2);
    ObjectSet("HL", OBJPROP_PRICE2, u1);
    ObjectSet("HL", OBJPROP_BACK  , True);
    ObjectSet("HL", OBJPROP_RAY   , True);
    ObjectSet("HL", OBJPROP_STYLE , STYLE_DOT);
    ObjectSet("HL", OBJPROP_WIDTH , 1);
    ObjectSet("HL", OBJPROP_COLOR , indicator_color1);

    ObjectSet("LL", OBJPROP_TIME1 , iTime(NULL, FixedTF, x3));
    ObjectSet("LL", OBJPROP_TIME2 , Time[0]);
    ObjectSet("LL", OBJPROP_PRICE1, d2);
    ObjectSet("LL", OBJPROP_PRICE2, d1);
    ObjectSet("LL", OBJPROP_BACK  , True);
    ObjectSet("LL", OBJPROP_RAY   , True);
    ObjectSet("LL", OBJPROP_STYLE , STYLE_DOT);
    ObjectSet("LL", OBJPROP_WIDTH , 1);
    ObjectSet("LL", OBJPROP_COLOR , indicator_color2);
  }
}

//+------------------------------------------------------------------+
//| Óðàâíåíèå ïðÿìîé.                                                |
//| Âû÷èñëÿåò çíà÷åíèå Y äëÿ X â òî÷êå ïåðåñå÷åíèÿ ñ ïðÿìîé.         |
//| Ïàðàìåòðû:                                                       |
//|   x1,y1 - êîîðäèíàòû ïåðâîé òî÷êè,                               |
//|   x2,y2 - êîîðäèíàòû âòîðîé òî÷êè,                               |
//|   x     - çíà÷åíèå, äëÿ êîòîðîãî âû÷èñëèòü Y                     |
//+------------------------------------------------------------------+
double EquationDirect(double x1, double y1, double x2, double y2, double x) {
  if ((x2-x1)*(x-x1)==0) return(y1);
  return((y2-y1)/(x2-x1)*(x-x1)+y1);
}
//+------------------------------------------------------------------+
Comments