Keltner Channels
Download script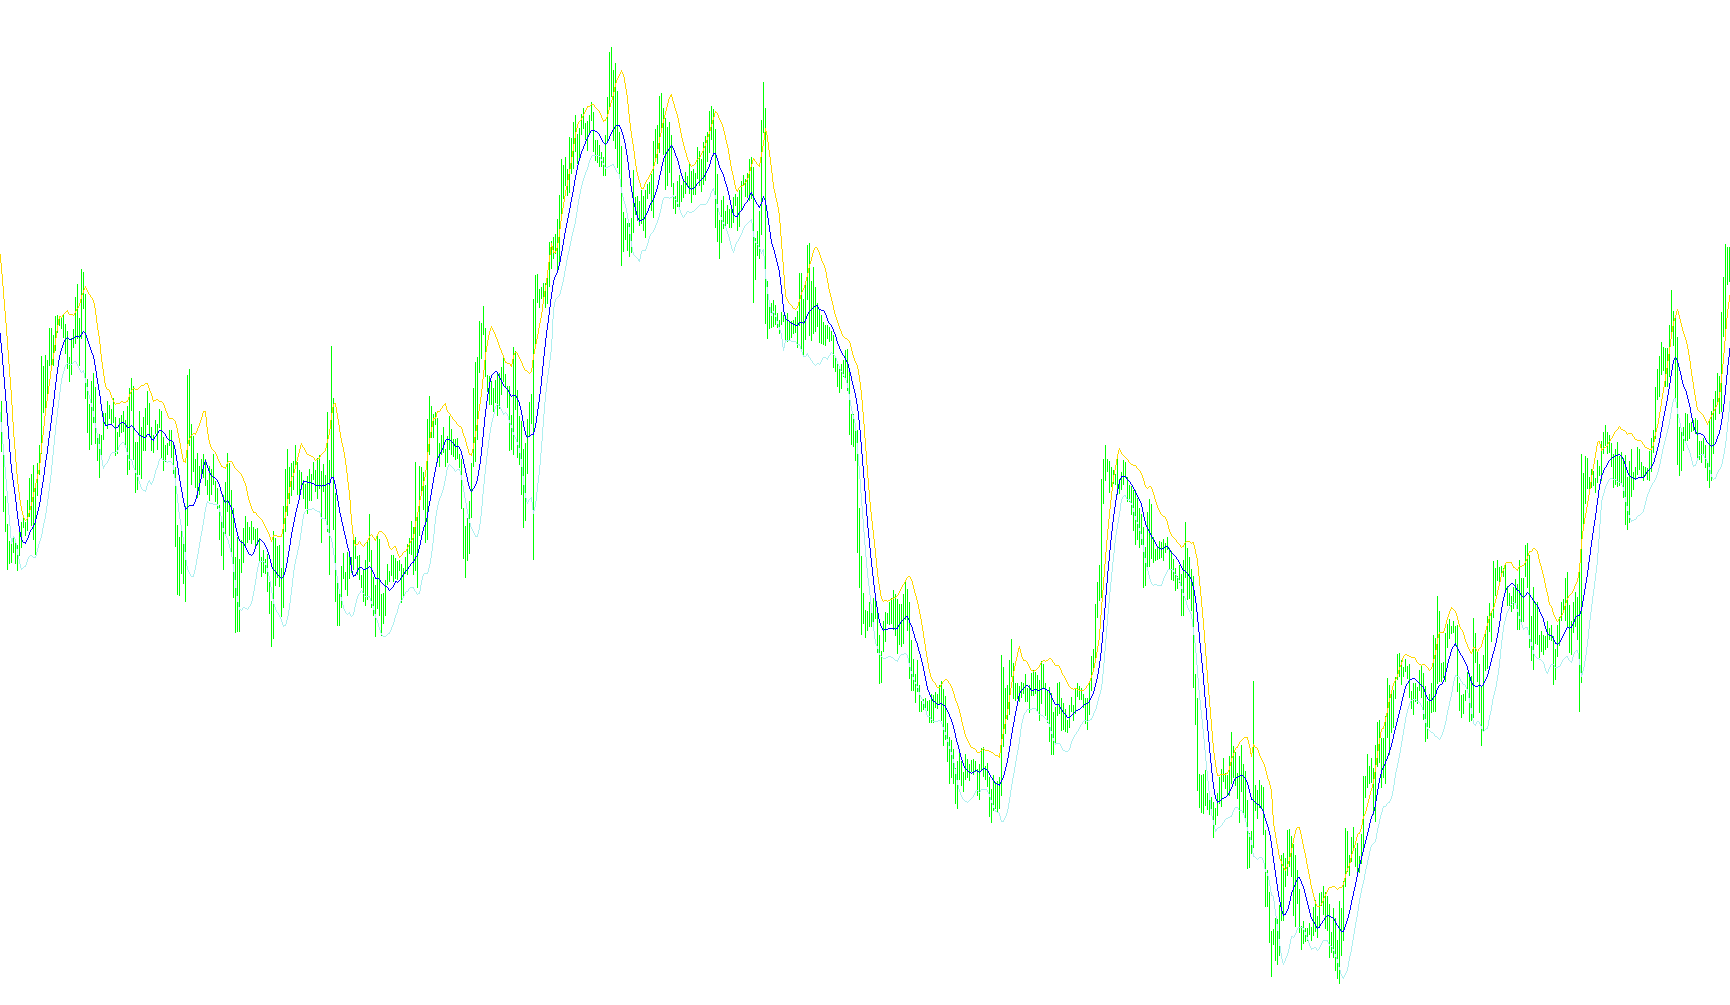
This tool is designed to provide a visual representation of market volatility and price trends by plotting three distinct lines on your trading chart. It helps traders identify the "normal" range of price movement while highlighting periods where the market may be overextending or consolidating.
How it Works
The script calculates three specific levels based on the recent history of the market:
1. The Middle Line (The Baseline) At its core, the tool identifies a central trend line. This is calculated by taking the average price of the assets over a specific timeframe (the "period"). Think of this as the "fair value" or the equilibrium point of the market at any given moment.
2. The Upper and Lower Boundaries (The Channels) To show how much the price typically fluctuates away from that middle baseline, the tool creates two outer boundaries:
- The Upper Channel: This line sits above the middle line, representing the upper limit of typical price movement.
- The Lower Channel: This line sits below the middle line, representing the lower limit of typical price movement.
The Logic Behind the Math
To determine how far away these outer boundaries should be from the center, the script looks at the "range" of the candles—specifically the distance between the highest and lowest points reached during each period.
By calculating the average size of these price swings, the tool establishes a "buffer zone." It then adds this buffer to the middle line to create the top ceiling and subtracts it from the middle line to create the floor.
Summary for Traders
The result is a three-line channel that follows the price action. When the price stays within these lines, the market is behaving according to its recent historical volatility. When the price pushes outside of these boundaries, it can signal that the market is experiencing unusual strength or weakness, potentially indicating an upcoming trend change or a period of extreme volatility.
//+------------------------------------------------------------------+
//|                                             Keltner Channels.mq4 |
//|                                                  Coded by Gilani |
//|                      Copyright © 2005, MetaQuotes Software Corp. |
//|                                        http://www.metaquotes.net |
//+------------------------------------------------------------------+
#property copyright "Copyright © 2005, MetaQuotes Software Corp."
#property link      "http://www.metaquotes.net"
//+------------------------------------------------------------------+
//| Custom indicator initialization function                         |
//+------------------------------------------------------------------+
#property indicator_chart_window
#property indicator_buffers 3
#property indicator_color1 White
#property indicator_color2 White
#property indicator_color3 White


double upper[], middle[], lower[];
extern int period = 10;


int init()
  {
   SetIndexStyle(0,DRAW_LINE);
   SetIndexShift(0,0);
   SetIndexDrawBegin(0,0);
   SetIndexBuffer(0,upper);

   SetIndexStyle(1,DRAW_LINE);
   SetIndexShift(1,0);
   SetIndexDrawBegin(1,0);
   SetIndexBuffer(1,middle);

   SetIndexStyle(2,DRAW_LINE);
   SetIndexShift(2,0);
   SetIndexDrawBegin(2,0);
   SetIndexBuffer(2,lower);


//---- indicators
//----
   return(0);
  }
//+------------------------------------------------------------------+
//| Custor indicator deinitialization function                       |
//+------------------------------------------------------------------+
int deinit()
  {
//---- TODO: add your code here

//----
   return(0);
  }
//+------------------------------------------------------------------+
//| Custom indicator iteration function                              |
//+------------------------------------------------------------------+
int start() {
   int limit;
   int counted_bars=IndicatorCounted();
   if(counted_bars<0) return(-1);
   if(counted_bars>0) counted_bars--;
   limit=Bars-counted_bars;

   double avg;

   for(int x=0; x<limit; x++) {
      middle[x] = iMA(NULL, 0, period, 0, MODE_SMA, PRICE_TYPICAL, x);
      avg  = findAvg(period, x);
      upper[x] = middle[x] + avg;
      lower[x] = middle[x] - avg;
   }
   return(0);
  }
//+------------------------------------------------------------------+


   double findAvg(int period, int shift) {
      double sum=0;
      for (int x=shift;x<(shift+period);x++) {
         sum += High[x]-Low[x];
      }
      sum = sum/period;
      return (sum);
   }
Comments