K-ang_AutoCh_HL-v4
Download script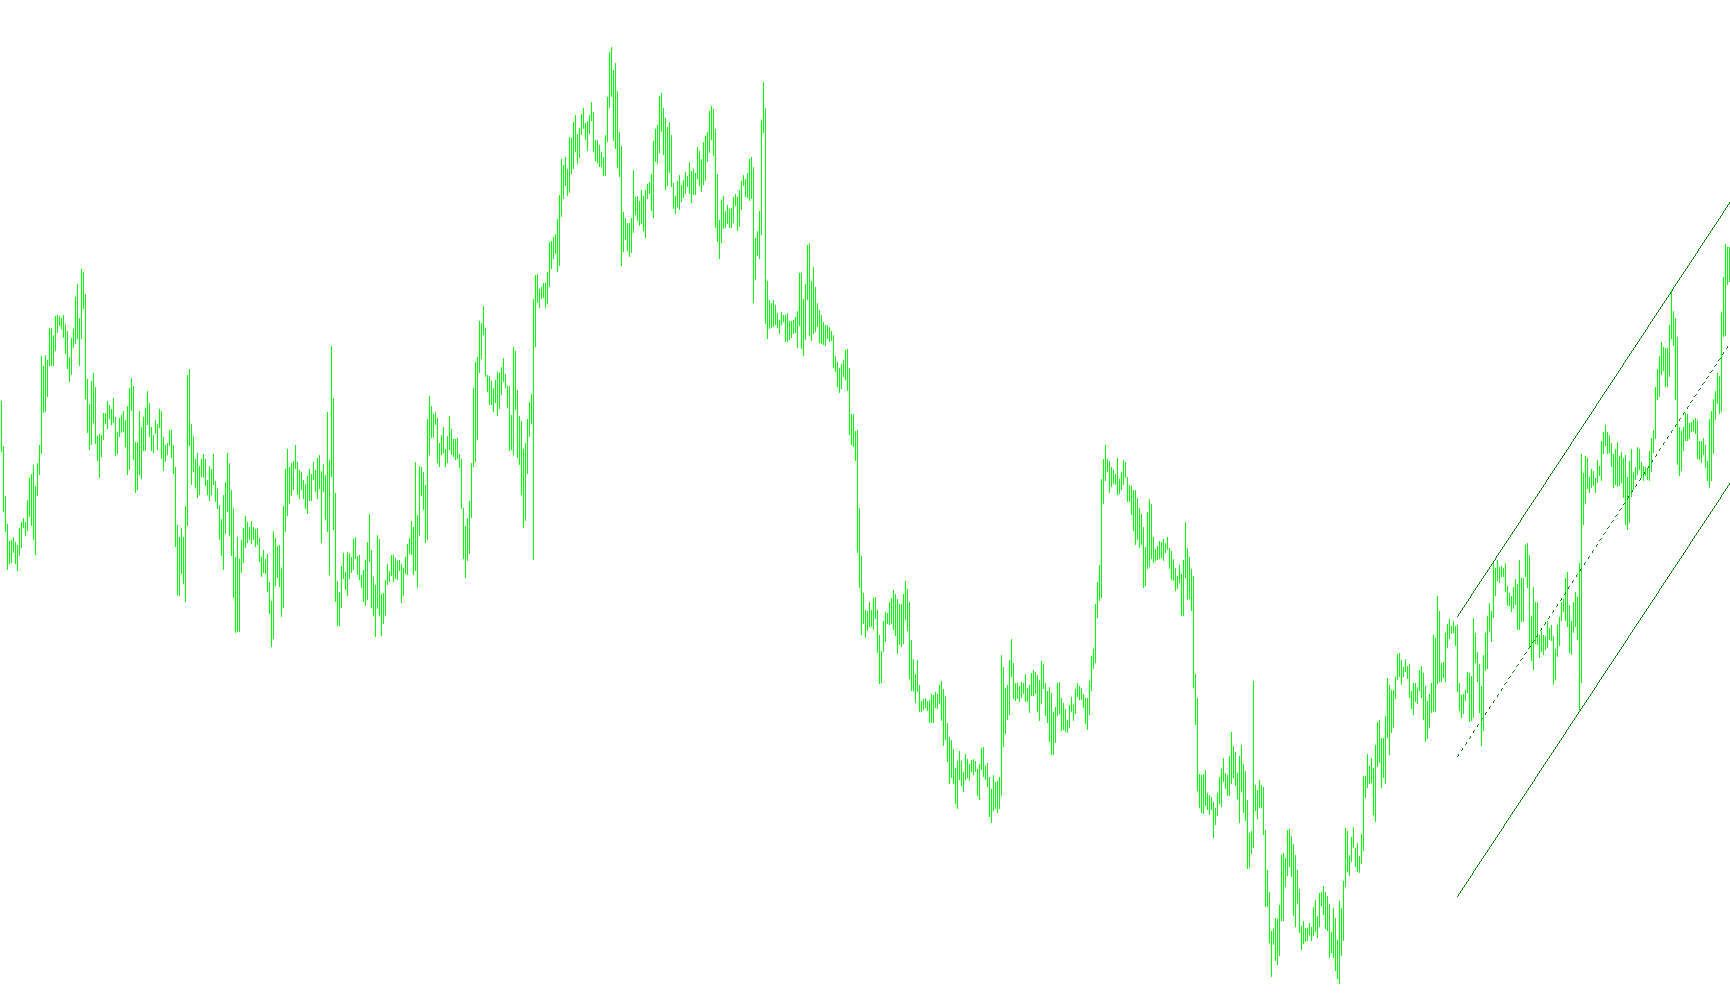
This script is designed to analyze historical price movements and project potential future price levels based on mathematical trends. It functions by identifying specific patterns in market behavior over a user-defined period and drawing visual guides on the chart to help traders visualize these trajectories.
Core Logic and Workflow
1. Data Collection and Trend Calculation The script begins by looking at a specific number of past candles (based on the hours provided in the settings). It uses a linear regression formula—a statistical method to find the "best fit" line through a series of data points. This helps the tool understand the general direction and momentum of the market, filtering out minor noise to establish a baseline trend.
2. Identifying Market Extremes Once the general trend is established, the script splits the historical data into two halves. It then scans these sections to find significant "peaks" (highs) and "troughs" (lows). By identifying these specific extremes, the logic can determine whether the market is reacting more strongly to upper resistance levels or lower support levels.
3. Determining Market Bias The script compares the behavior of the highs versus the lows to decide which type of movement is currently dominating. It calculates the distance between the peaks and the troughs to determine a "bias." Essentially, it decides whether the price action is being driven more by "selling pressure" (resistance) or "buying pressure" (support).
4. Projection and Visualization After determining the dominant bias, the script performs a geometric projection. It calculates where the price should land at the current moment based on the slope of the identified peaks or troughs.
Finally, it renders three distinct visual lines on your chart:
- The Primary Projection: A direct continuation of the trend.
- The Mid-Point Projection: A balanced middle ground between the extreme levels.
- The Extended Projection: An outer boundary based on the calculated volatility.
Summary for the User
In simple terms, this tool looks at how much the price has moved over a set number of hours, finds the most important "highs" and "lows" in that period, and draws three lines on your current chart. These lines act as a roadmap, showing you where the price is mathematically likely to head based on the historical momentum of the recent market trend.
#property  copyright "ANG3110@latchess.com"
//----------------------------------
#property indicator_chart_window
//----------------------------------
extern int Hours=24;
extern color col=Green;
//------------------
double lr,lr0,lrp;
double sx,sy,sxy,sx2,aa,bb;
int p,sName,fs;
int f,f0,f1;
double dh,dl,dh_1,dl_1,dh_2,dl_2;
int ai_1,ai_2,bi_1,bi_2;
double hai,lai,dhi,dli,dhm,dlm,ha0,hap,la0,lap;
double price_p1,price_p0,price_p2,price_01,price_00,price_02;
int p1,p0,p2,fp;
//*****************************************
int init() {
p=Hours*240/Period();
if (fs==0) {sName=CurTime(); fs=1;}
return(0);}
//*******************************
int deinit() {
   ObjectDelete("1"+sName);
   ObjectDelete("0"+sName);
   ObjectDelete("2"+sName); }
//*******************************
int start() {
int i,n;
//------------------------------------------------------------------------------
if (f==1) {
p1=iBarShift(Symbol(),Period(),ObjectGet("1"+sName,OBJPROP_TIME1));
p0=iBarShift(Symbol(),Period(),ObjectGet("0"+sName,OBJPROP_TIME1));
p2=iBarShift(Symbol(),Period(),ObjectGet("2"+sName,OBJPROP_TIME1));
if (fp==0 && p!=p1) {p=p1; fp=1;}
if (fp==0 && p!=p0) {p=p0; fp=1;}
if (fp==0 && p!=p2) {p=p2; fp=1;}
}
//====================================================
sx=0; sy=0; sxy=0; sx2=0;
for (n=0; n<=p; n++) {sx+=n; sy+=Close[n]; sxy+=n*Close[n]; sx2+=MathPow(n,2);}
aa=(sx*sy-(p+1)*sxy)/(MathPow(sx,2)-(p+1)*sx2); bb=(sy-aa*sx)/(p+1);
//----------------------------------------------------
for (i=0; i<=p; i++) {
lr=bb+aa*i;
dh=High[i]-lr; dl=Low[i]-lr;
//----------------------------------------------------
if (i<p/2) {if (i==0) {dh_1=0.0; dl_1=0.0; ai_1=i; bi_1=i;}
if (dh>=dh_1) {dh_1=dh; ai_1=i;}
if (dl<=dl_1) {dl_1=dl; bi_1=i;}}
//----------------------------------------------------
if (i>=p/2) {if (i==p/2) {dh_2=0.0; dl_2=0.0; ai_2=i; bi_2=i;}
if (dh>=dh_2) {dh_2=dh; ai_2=i;}
if (dl<=dl_2) {dl_2=dl; bi_2=i;}}}
//-------------------------------------
lr0=bb; lrp=bb+aa*(i+p);
//===================================================
if (MathAbs(ai_1-ai_2)>MathAbs(bi_1-bi_2)) f=1;
if (MathAbs(ai_1-ai_2)<MathAbs(bi_1-bi_2)) f=2;
if (MathAbs(ai_1-ai_2)==MathAbs(bi_1-bi_2)) {if (MathAbs(dh_1-dh_2)<MathAbs(dl_1-dl_2)) f=1; if (MathAbs(dh_1-dh_2)>=MathAbs(dl_1-dl_2)) f=2;}
//=================================================
if (f==1) {
for (n=0; n<=20; n++) { f1=0;
for (i=0; i<=p; i++) {hai=High[ai_1]*(i-ai_2)/(ai_1-ai_2)+High[ai_2]*(i-ai_1)/(ai_2-ai_1);
if (i==0 || i==p/2) dhm=0.0;
if (High[i]-hai>dhm && i<p/2) {ai_1=i; f1=1;}
if (High[i]-hai>dhm && i>=p/2) {ai_2=i; f1=1;} }
if (f==0) break;}
//----------------------------
for (i=0; i<=p; i++) {hai=High[ai_1]*(i-ai_2)/(ai_1-ai_2)+High[ai_2]*(i-ai_1)/(ai_2-ai_1);
dli=Low[i]-hai;
if (i==0) dlm=0.0; if (dli<dlm) dlm=dli;}
ha0=High[ai_1]*(0-ai_2)/(ai_1-ai_2)+High[ai_2]*(0-ai_1)/(ai_2-ai_1);
hap=High[ai_1]*(p-ai_2)/(ai_1-ai_2)+High[ai_2]*(p-ai_1)/(ai_2-ai_1);
//----------------------------
price_p1=hap;
price_p0=hap+dlm/2;
price_p2=hap+dlm;
price_01=ha0;
price_00=ha0+dlm/2;
price_02=ha0+dlm;
}
//=================================================
if (f==2) {
for (n=0; n<=20; n++) { f1=0;
for (i=0; i<=p; i++) {lai=Low[bi_1]*(i-bi_2)/(bi_1-bi_2)+Low[bi_2]*(i-bi_1)/(bi_2-bi_1);
if (i==0 || i==p/2) dlm=0.0;
if (Low[i]-lai<dlm && i<p/2) {bi_1=i; f1=1;}
if (Low[i]-lai<dlm && i>=p/2) {bi_2=i; f1=1;}}
if (f==0) break;}
//----------------------------
for (i=0; i<=p; i++) {lai=Low[bi_1]*(i-bi_2)/(bi_1-bi_2)+Low[bi_2]*(i-bi_1)/(bi_2-bi_1);
dhi=High[i]-lai;
if (i==0) dhm=0.0; if (dhi>dhm) dhm=dhi;}
la0=Low[bi_1]*(0-bi_2)/(bi_1-bi_2)+Low[bi_2]*(0-bi_1)/(bi_2-bi_1);
lap=Low[bi_1]*(p-bi_2)/(bi_1-bi_2)+Low[bi_2]*(p-bi_1)/(bi_2-bi_1);
//----------------------------------------------------------------
price_p1=lap;
price_p0=lap+dhm/2;
price_p2=lap+dhm;
price_01=la0;
price_00=la0+dhm/2;
price_02=la0+dhm;
}
//===================================================================================
ObjectCreate("1"+sName,2, 0,Time[p],price_p1,Time[0],price_01);
ObjectCreate("0"+sName,2, 0,Time[p],price_p0,Time[0],price_00);
ObjectCreate("2"+sName,2, 0,Time[p],price_p2,Time[0],price_02);
//-----------------------------------------------------------------
ObjectSet("1"+sName,OBJPROP_COLOR,col);
ObjectSet("0"+sName,OBJPROP_COLOR,col);
ObjectSet("0"+sName,OBJPROP_STYLE,STYLE_DOT);
ObjectSet("2"+sName,OBJPROP_COLOR,col);
//---------------------------------------------
ObjectSet("1"+sName,OBJPROP_TIME1,Time[p]);
ObjectSet("1"+sName,OBJPROP_PRICE1,price_p1);
ObjectSet("1"+sName,OBJPROP_TIME2,Time[0]);
ObjectSet("1"+sName,OBJPROP_PRICE2,price_01);
ObjectSet("0"+sName,OBJPROP_TIME1,Time[p]);
ObjectSet("0"+sName,OBJPROP_PRICE1,price_p0);
ObjectSet("0"+sName,OBJPROP_TIME2,Time[0]);
ObjectSet("0"+sName,OBJPROP_PRICE2,price_00);
ObjectSet("2"+sName,OBJPROP_TIME1,Time[p]);
ObjectSet("2"+sName,OBJPROP_PRICE1,price_p2);
ObjectSet("2"+sName,OBJPROP_TIME2,Time[0]);
ObjectSet("2"+sName,OBJPROP_PRICE2,price_02);
//==================================================================
f=1; p1=p; p0=p; p2=p; fp=0;
//*************************************************************************************
return(0);}
//=====================================================================================
Comments