KaufWMAcross
Download script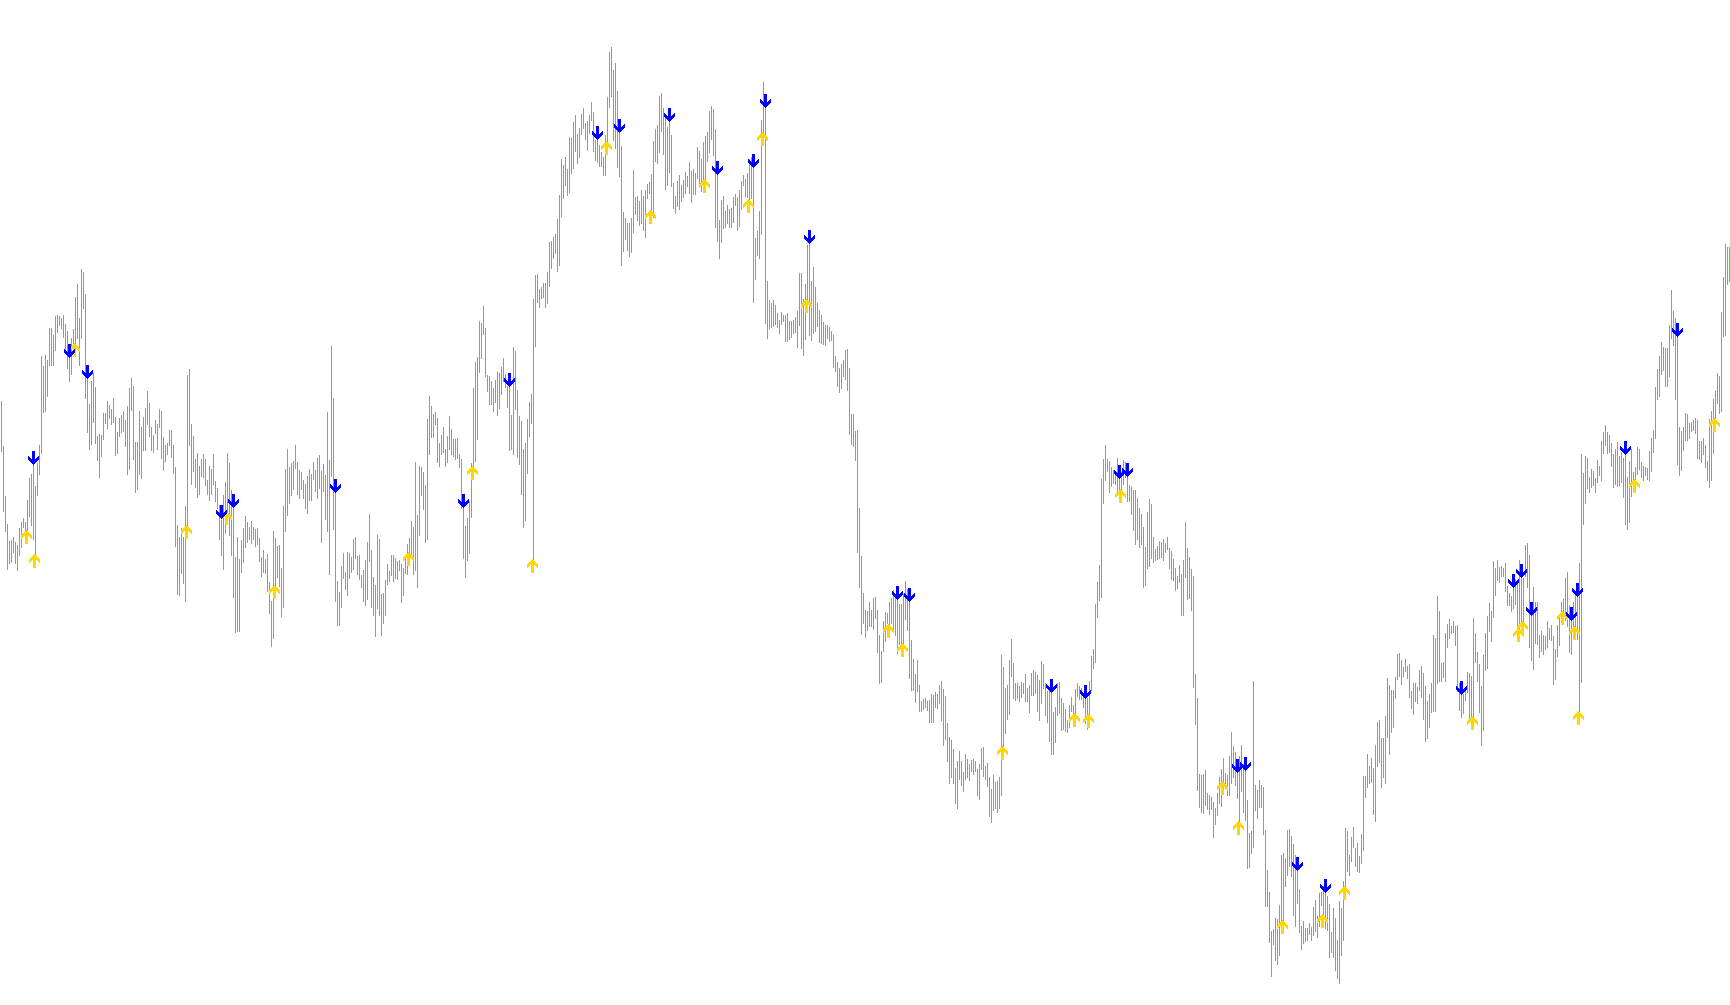
This script is a specialized technical analysis tool designed to identify specific momentum shifts in financial markets by monitoring the interaction between two different types of moving averages. Its primary goal is to signal "crossover" moments, which traders often use as cues to enter or exit positions.
Core Logic Overview
The tool functions by comparing two distinct mathematical models of price action:
- Kaufman Adaptive Moving Average (KAMA): This is a sophisticated indicator that adjusts its sensitivity based on market volatility. It helps smooth out "noise" during choppy markets while reacting more quickly to strong, consistent trends.
- Linear Weighted Moving Average (LWMA): This is a faster, standard moving average that gives more importance to the most recent price data, allowing it to react quickly to immediate price changes.
How It Identifies Signals
The script constantly scans the historical price data to see where these two averages intersect. It looks for two specific types of behavior:
- Bullish Signal (Upside Cross): The tool detects when the Kaufman indicator moves from being above the LWMA to falling below it (or vice versa, depending on the trajectory), specifically signaling a shift toward upward momentum. When this occurs, the script places a visual marker (a blue arrow) below the price candle and triggers an alert notification.
- Bearish Signal (Downside Cross): Conversely, the tool monitors for when the indicators cross in a way that suggests downward pressure. When this happens, it places a red arrow above the price candle and issues an alert.
Smart Adjustments
To ensure the visual markers remain clear and do not overlap with the actual price bars, the script includes a dynamic "offset" logic. It automatically calculates how far away from the candle to place the arrows based on the specific timeframe you are viewing (e.g., it will place the icons further away on long-term daily charts and closer on fast-paced 1-minute charts).
User Experience Features
- Visual Cues: Instead of just providing numbers, the script draws colored arrows directly on your chart to highlight exactly where the crossover occurred.
- Real-Time Alerts: The script features an automated notification system. When a crossover happens in real-time, it sends an instant alert containing details about the specific currency pair and timeframe, ensuring you don't have to watch the screen constantly.
- Customizable Parameters: Users can adjust the "Periods" for both indicators, allowing you to choose between a more aggressive strategy (shorter periods) or a more conservative, smoothed-out approach (longer periods).
//+------------------------------------------------------------------+
//|                                                 KaufWMAcross.mq4 |
//|                      Copyright © 2007, MetaQuotes Software Corp. |
//|                                        http://www.metaquotes.net |
//+------------------------------------------------------------------+
#property copyright "Copyright © 2007, MetaQuotes Software Corp."
#property link "http://www.metaquotes.net"

#property indicator_chart_window
#property indicator_buffers 2
#property indicator_color1 Blue
#property indicator_color2 Red
//---- input parameters
extern int KaufPeriod = 9;
extern int WMAPeriod = 5;
//---- buffers
double ExtMapBuffer1[];
double ExtMapBuffer2[];
//----
double kf0,kf1,wma0,wma1;
int    nShift;
datetime Newbar;
bool Alerts_on= true;
//+------------------------------------------------------------------+
//| Custom indicator initialization function                         |
//+------------------------------------------------------------------+
int init()
  {
//---- indicators
    SetIndexStyle(0, DRAW_ARROW, 0, 1);
    SetIndexArrow(0, 233);
    SetIndexBuffer(0, ExtMapBuffer1);
//----
    SetIndexStyle(1, DRAW_ARROW, 0, 1);
    SetIndexArrow(1, 234);
    SetIndexBuffer(1, ExtMapBuffer2);
//---- name for DataWindow and indicator subwindow label
    IndicatorShortName("KaufWMAcrosses("+KaufPeriod+","+WMAPeriod);
    SetIndexLabel(0, "CrossUp");
    SetIndexLabel(1, "CrossDn");
//----
    switch(Period())
      {
        case     1: nShift = 1;   break;
        case     5: nShift = 3;   break;
        case    15: nShift = 5;   break;
        case    30: nShift = 10;  break;
        case    60: nShift = 15;  break;
        case   240: nShift = 20;  break;
        case  1440: nShift = 80;  break;
        case 10080: nShift = 100; break;
        case 43200: nShift = 200; break;
      }
//----
    return(0);
  }
//+------------------------------------------------------------------+
//| Custor indicator deinitialization function                       |
//+------------------------------------------------------------------+
int deinit()
  {
//----
    return(0);
  }
//+------------------------------------------------------------------+
//| Custom indicator iteration function                              |
//+------------------------------------------------------------------+
int start()
  {
    int limit;
    int counted_bars = IndicatorCounted();
//---- check for possible errors
    if(counted_bars < 0)
        return(-1);
//---- last counted bar will be recounted
    if(counted_bars > 0)
        counted_bars--;
    limit = Bars - counted_bars;
//----


    for(int i = 0; i < limit; i++)
      {
        kf1 = iCustom(NULL, 0,"Kaufman2",KaufPeriod,2,30,2, 0, i + 1);
        kf0 = iCustom(NULL, 0,"Kaufman2",KaufPeriod,2,30,2, 0, i);
        wma1 = iMA(NULL, 0, WMAPeriod, 0,MODE_LWMA,PRICE_CLOSE, i + 1);
        wma0 = iMA(NULL, 0, WMAPeriod, 0,MODE_LWMA,PRICE_CLOSE, i );
        //----


        if(kf1 > wma1 && kf0 < wma0)
           { ExtMapBuffer1[i] = Low[i] - nShift*Point;
           if(Alerts_on && Newbar!=Time[0])
           Alert("WMA crossed KaufamnMA to the Upside in the "+Period()+" minute "+Symbol()+" chart");}
        //----
        if(kf1 < wma1 && kf0 > wma0)
            {ExtMapBuffer2[i] = High[i] + nShift*Point;
            if(Alerts_on && Newbar!=Time[0])
             Alert("WMA crossed KaufamnMA to the Downside in the "+Period()+" minute "+Symbol()+" chart");}
         Newbar=Time[0];

       }


//----
    return(0);
  }
//+------------------------------------------------------------------+
Comments