Kaufman_Bands_v2
Download script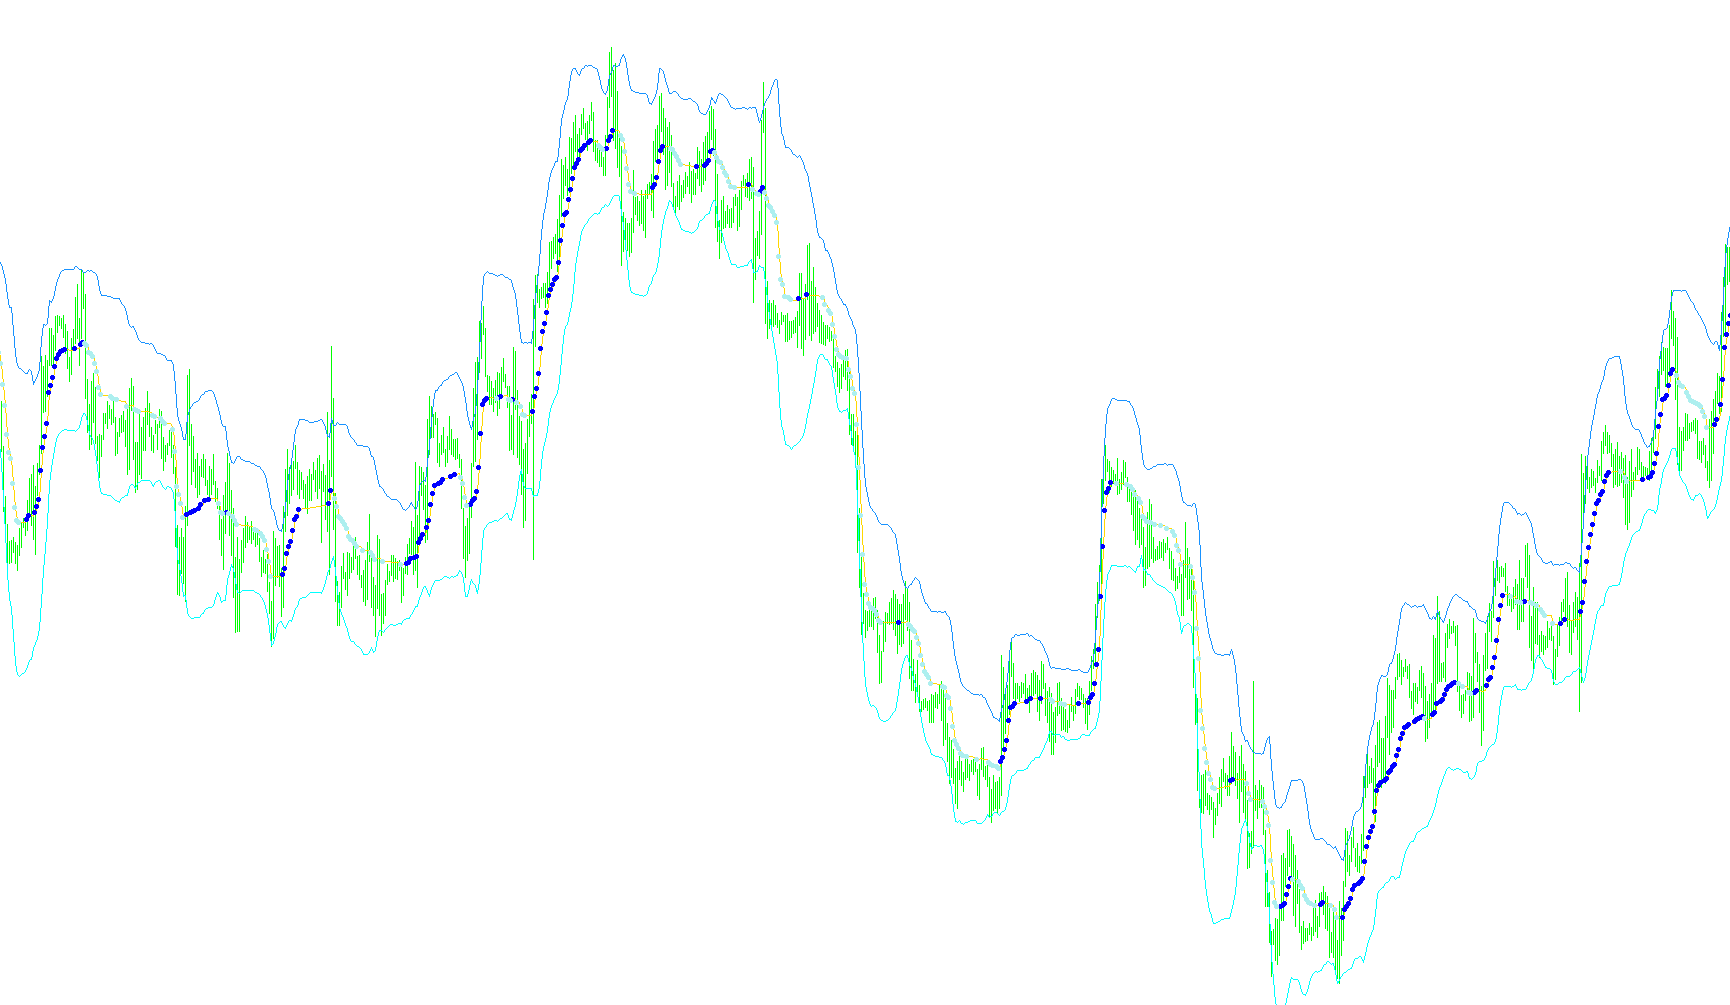
This tool is designed to provide traders with a sophisticated visual analysis of market price trends by filtering out "market noise" and identifying significant momentum shifts. It combines three distinct mathematical concepts—the Kaufman Adaptive Moving Average (KAMA), volatility bands, and momentum signals—into a single cohesive display.
Core Logic Overview
1. Adaptive Trend Smoothing (KAMA) Unlike standard moving averages that react identically to all price movements, this script uses an "adaptive" logic. It calculates the Efficiency Ratio of the market. This means it distinguishes between efficient moves (clear trends) and inefficient moves (choppy, sideways markets).
- In a strong trend, the indicator adjusts to follow the price more closely.
- In a choppy or noisy market, the indicator flattens out to avoid giving false signals based on minor fluctuations.
2. Volatility Mapping (Bollinger Bands) The script overlays dynamic "bands" around the adaptive trend line. These bands calculate the standard deviation of the price relative to the moving average over a specific period. This provides a visual representation of market volatility:
- Narrower Bands: Suggest a period of low volatility or consolidation.
- Wider Bands: Indicate high-intensity price swings and significant momentum.
3. Momentum Signal Identification Beyond just showing lines on the chart, the script includes logic to identify specific "action" points. It monitors the difference between the current smoothed value and its preceding value:
- Upward Signals: When the trend moves upward by a specific minimum threshold, the script flags this as a potential bullish move.
- Downward Signals: When the trend moves downward by that same threshold, it flags a potential bearish move.
Summary of Visual Output
For a user viewing the chart, these components work together to create a comprehensive environment:
- The Primary Line shows the filtered direction of the market, smoothed to ignore minor distractions.
- The Upper and Lower Bands define the "territory" of current price action, highlighting how much the price is deviating from the norm.
- The Signal Arrows act as visual alerts, pinpointing moments where the trend's momentum has crossed a significant enough threshold to potentially signal a change in market direction.
//+------------------------------------------------------------------+
//|                                                      Kaufman.mq4 |
//|                             Copyright © -2005, by konKop & wellx |
//|                                        http://www.metaquotes.net |
//+------------------------------------------------------------------+

#property copyright "Copyright © 2003-2004, by konKop, for MT GOODMAN,af,Mstera ,wellx "
#property link      "http://www.metaquotes.net"

#property indicator_chart_window
#property indicator_buffers 5
#property indicator_color1 Sienna
#property indicator_color2 DeepSkyBlue
#property indicator_color3 Gold
#property indicator_color4 White
#property indicator_color5 White

//---- input parameters
extern int       periodAMA=9;
extern int       nfast=2;
extern int       nslow=30;
extern double    G=2.0;
extern double    dK=2.0;
extern int BollingerPeriod=20;
extern double K_Bollinger=2.0;
//---- buffers
double kAMAbuffer[];
double kAMAupsig[];
double kAMAdownsig[];
double UpBand[];
double DownBand[];
//+------------------------------------------------------------------+

int    k=0, cbars=0, prevbars=0, prevtime=0;

double slowSC,fastSC;

//+------------------------------------------------------------------+
//| Custom indicator initialization function                         |
//+------------------------------------------------------------------+
int init()
  {
//---- indicators
   SetIndexStyle(0,DRAW_LINE);
   SetIndexStyle(1,DRAW_ARROW);
   SetIndexArrow(1,159);
   SetIndexStyle(2,DRAW_ARROW);
   SetIndexArrow(2,159);
   SetIndexStyle(3,DRAW_LINE);
   SetIndexStyle(4,DRAW_LINE);
   //SetIndexDrawBegin(0,nslow+nfast);
   SetIndexBuffer(0,kAMAbuffer);
   SetIndexBuffer(1,kAMAupsig);
   SetIndexBuffer(2,kAMAdownsig);
   SetIndexBuffer(3,UpBand);
   SetIndexBuffer(4,DownBand);

   IndicatorDigits(4);

//----
   return(0);
  }
//+------------------------------------------------------------------+
//| Custom indicator deinitialization function                       |
//+------------------------------------------------------------------+
int deinit()
  {
   return(0);
  }
//+------------------------------------------------------------------+
//| Custom indicator iteration function                              |
//+------------------------------------------------------------------+
int start()
  {
   int    i,pos=0;
   double noise=0.000000001,AMA,AMA0,signal,ER;
   double dSC,ERSC,SSC,ddK;
   int counter_Boll;
   double deviation;

   if (prevbars==Bars) return(0);

//---- TODO: add your code here
   slowSC=(2.0 /(nslow+1));
   fastSC=(2.0 /(nfast+1));
   cbars=IndicatorCounted();
   if (Bars<=(periodAMA+2)) return(0);
//---- check for possible errors
   if (cbars<0) return(-1);
//---- last counted bar will be recounted
   if (cbars>0) cbars--;
   pos=Bars-periodAMA-2;
   AMA0=Close[pos+1];
   while (pos>=0)
     {
      kAMAupsig[pos]=NULL;
      kAMAdownsig[pos]=NULL;
      if(pos==Bars-periodAMA-2) AMA0=Close[pos+1];
      signal=MathAbs(Close[pos]-Close[pos+periodAMA]);
      noise=0.000000001;
      for(i=0;i<periodAMA;i++)
       {
        noise=noise+MathAbs(Close[pos+i]-Close[pos+i+1]);
       }
      ER =signal/noise;
      dSC=(fastSC-slowSC);
      ERSC=ER*dSC;
      SSC=ERSC+slowSC;
      AMA=AMA0+(MathPow(SSC,G)*(Close[pos]-AMA0));
      kAMAbuffer[pos]=AMA;
      deviation=0;
      for (counter_Boll=0;counter_Boll<BollingerPeriod;counter_Boll++) deviation=deviation+MathPow(Close[pos+counter_Boll]-kAMAbuffer[pos+counter_Boll],2);
      deviation=MathSqrt(deviation/BollingerPeriod);
      UpBand[pos]=AMA+deviation*K_Bollinger;
      DownBand[pos]=AMA-deviation*K_Bollinger;
      ddK=(AMA-AMA0);
      if ((MathAbs(ddK) > (dK*Point)) && (ddK > 0))  kAMAupsig[pos]  =AMA;
      if ((MathAbs(ddK)) > (dK*Point) && (ddK < 0))  kAMAdownsig[pos]=AMA;

      AMA0=AMA;
      pos--;
     }
//----
   prevbars=Bars;
   return(0);
  }
Comments