KasePeakOscilator_v1
Download script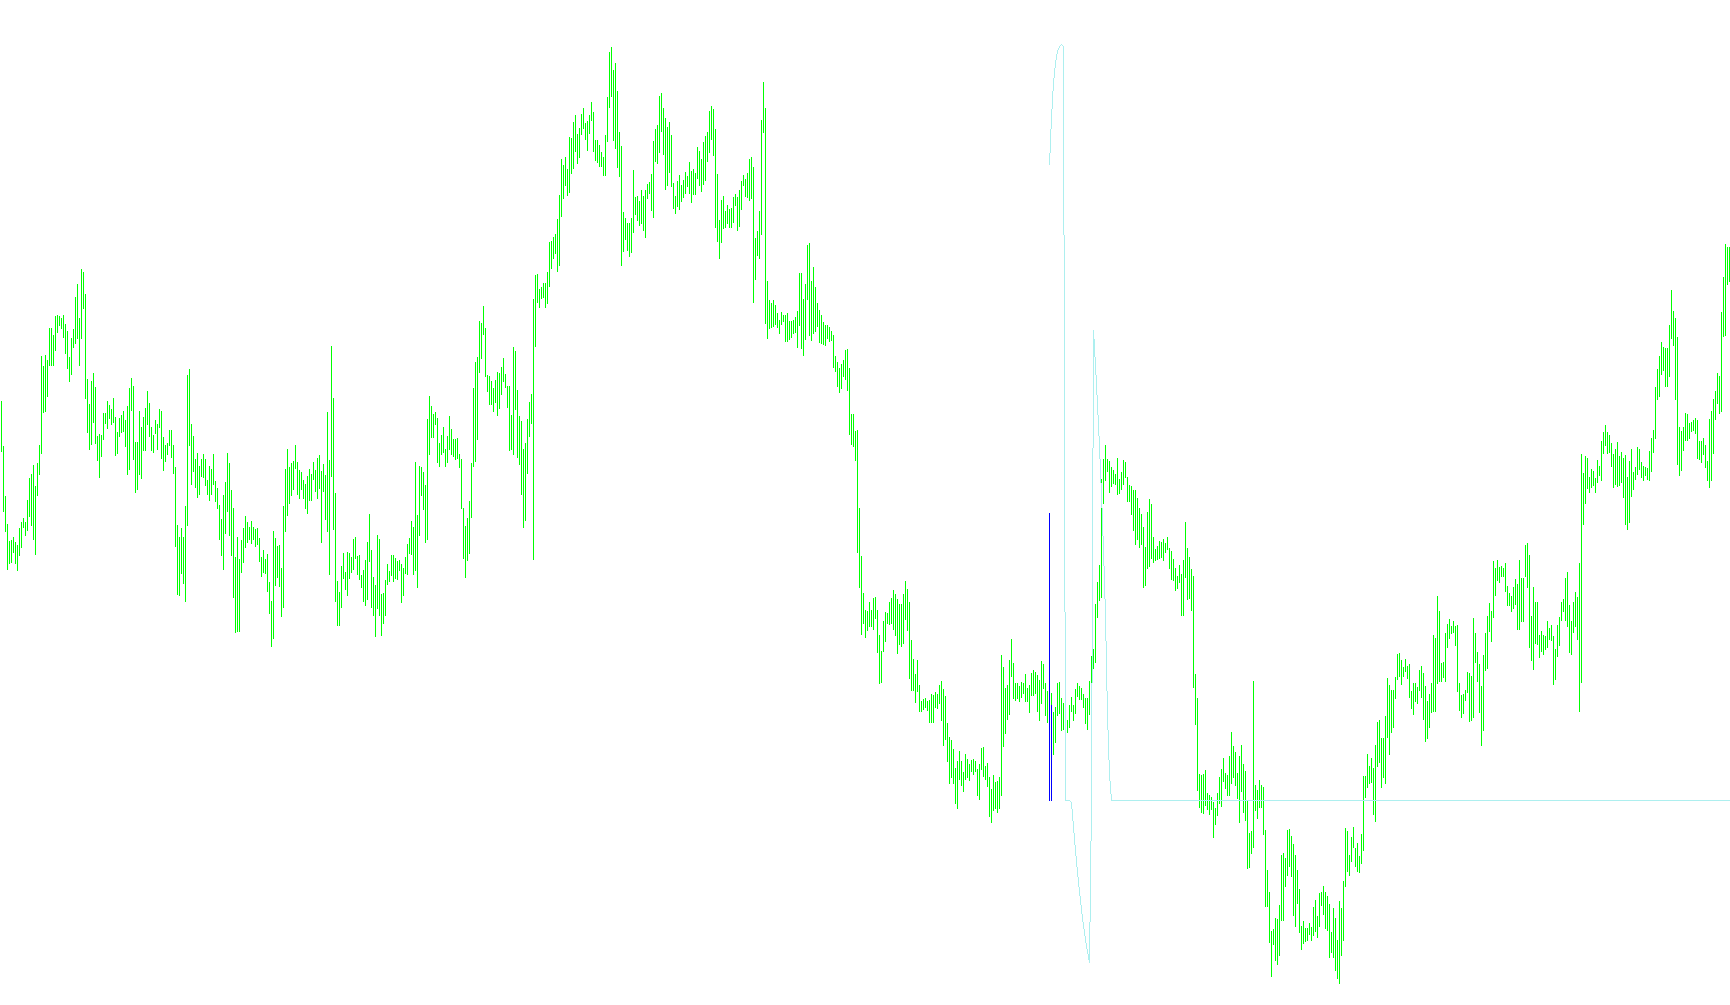
The KasePeakOscillator is a specialized technical analysis tool designed to identify momentum shifts and price extremes by analyzing historical price movement. It processes raw market data through several mathematical layers to filter out "noise" and highlight significant trends for the trader.
Core Logic and Methodology
1. Relative Range Calculation The script begins by measuring the price range over a specific period. Instead of looking at simple price changes, it calculates a relative value by comparing the distance between current highs/lows against the market's volatility (Standard Deviation). This helps the tool understand if a price move is "normal" or "extreme" relative to recent history.
2. Smoothing and Trend Identification Once the raw range is calculated, the script applies multiple layers of smoothing:
- Momentum Filtering: It uses a weighted average to smooth out the initial data, ensuring that minor price flickers do not trigger false signals.
- Moving Averages & Deviations: It then calculates a simple moving average and the standard deviation of that momentum. This establishes a "baseline" for what typical behavior looks like for the current asset.
3. Dynamic Boundary Creation The script establishes upper and lower "thresholds" based on the calculated volatility. By using a multiplier against the standard deviation, it creates dynamic boundaries. These are not fixed numbers; they expand and contract automatically as the market becomes more or less volatile. This allows the indicator to stay relevant whether the market is in a high-activity phase or a quiet consolidation phase.
4. Visual Signal Generation The final output of the logic is translated into three distinct visual components:
- Directional Histograms: The script compares the current momentum value to the previous one. If the momentum is increasing, it highlights the trend in green; if it is decreasing, it reflects it in red. This provides an immediate visual cue regarding the "strength" of the current move.
- The Baseline Line: A central line tracks the relationship between the momentum and the dynamic thresholds.
- If momentum remains above the upper threshold, the line reflects a bullish bias.
- If momentum falls below the lower threshold, it reflects a bearish bias.
- When momentum is neutral (between the boundaries), the line centers at zero.
Summary for the User
In essence, this script acts as a sophisticated "momentum thermometer." It ignores insignificant price wiggles and focuses on identifying when the market is moving with significant force in one direction or the other. By combining volatility-adjusted thresholds with smoothed momentum tracking, it provides a clearer picture of trend exhaustion and strength than standard price charts alone.
//+------------------------------------------------------------------+
//|                                         KasePeakOscilator_v1.mq4 |
//|                                                          Kalenzo |
//|                                      bartlomiej.gorski@gmail.com |
//+------------------------------------------------------------------+
#property copyright "Kalenzo"
#property link      "bartlomiej.gorski@gmail.com"

#property indicator_buffers 3
#property indicator_color1 Green
#property indicator_color2 Red
#property indicator_color3 Yellow

extern int KPeriod = 30;
extern int BarsToCalculate = 300;
double RWHL[];

double Pk[];
double PkGreen[];
double PkRed[];

double MN[];
double SD[];
double v1,v2;
double Line[];

#property indicator_separate_window
//+------------------------------------------------------------------+
//| Custom indicator initialization function                         |
//+------------------------------------------------------------------+
int init()
  {
//---- indicators
   IndicatorBuffers(7);

   SetIndexStyle(0,DRAW_HISTOGRAM,EMPTY,1);
   SetIndexBuffer(0,PkGreen);

   SetIndexStyle(1,DRAW_HISTOGRAM,EMPTY,1);
   SetIndexBuffer(1,PkRed);

   SetIndexStyle(2,DRAW_LINE,EMPTY,1);
   SetIndexBuffer(2,Line);

   SetIndexBuffer(3,RWHL);
   SetIndexBuffer(4,MN);
   SetIndexBuffer(5,SD);
   SetIndexBuffer(6,Pk);


//----
   return(0);
  }
//+------------------------------------------------------------------+
//| Custom indicator deinitialization function                       |
//+------------------------------------------------------------------+
int deinit()
  {
//----

//----
   return(0);
  }
//+------------------------------------------------------------------+
//| Custom indicator iteration function                              |
//+------------------------------------------------------------------+
int start()
  {

//----


   int limit = BarsToCalculate;

//----


   for(int i = 0; i <= limit; i++)
   {
      double H = (High[i]-Low[i+KPeriod])/(iATR(Symbol(),0,KPeriod,i)*MathSqrt(KPeriod));
      double L = (High[i+KPeriod]-Low[i])/(iATR(Symbol(),0,KPeriod,i)*MathSqrt(KPeriod));

      RWHL[i] = H - L;
   }


   for(int p = 0; p <= limit; p++) Pk[p] = iMAOnArray(RWHL,0,3,0,MODE_LWMA,p);
   for(int m = 0; m <= limit; m++) MN[m] = iMAOnArray(Pk,0,KPeriod,0,MODE_SMA,m);
   for(int s = 0; s <= limit; s++) SD[s] = iStdDevOnArray(Pk,0,KPeriod,MODE_SMA,0,s);


   for(int v = 0; v <= limit; v++)
   {
      if(MN[v]+(1.33*SD[v])>2.08)
      v1 = MN[v]+(1.33*SD[v]);
      else
      v1 = 2.08;

      if(MN[v]-(1.33*SD[v])<-1.92)
      v2 = MN[v]-(1.33*SD[v]);
      else
      v2 = -1.92;

      if(Pk[v+1]>Pk[v])
      {
         PkRed[v] = Pk[v];
         PkGreen[v] = 0;
      }
      else
      {
         PkRed[v] = 0;
         PkGreen[v] = Pk[v];
      }


      if(Pk[v+1] >= 0 && Pk[v] > 0)
      {
         Line[v] = v1;
      }
      else
      {
         if(Pk[v+1] <= 0 && Pk[v] < 0)
         {
            Line[v] = v2;
         }
         else
         {
            Line[v] = 0;
         }
      }
   }

//----
   return(0);
  }
//+------------------------------------------------------------------+
Comments