K-ang_AutoCh_HL-vD
Download script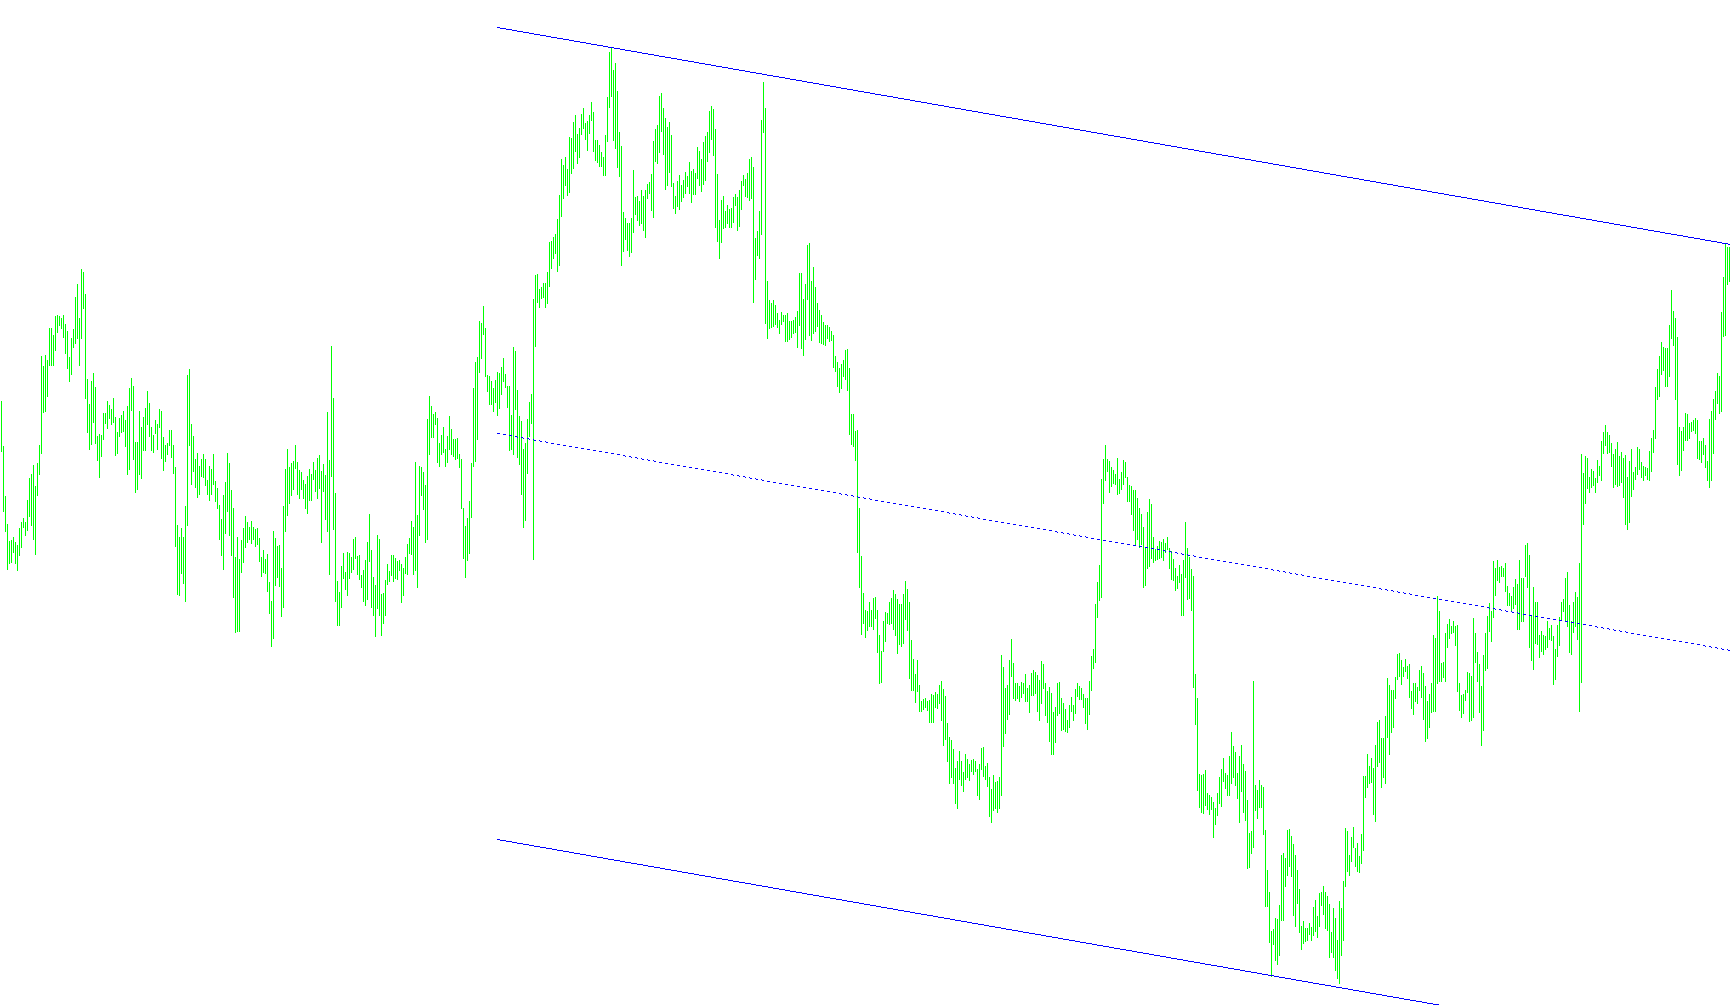
This script is designed for the MetaTrader platform to provide visual technical analysis by identifying and projecting price trends based on historical data. Instead of relying on simple moving averages, it employs a more sophisticated mathematical approach to determine how price is behaving over a specific timeframe.
Core Mathematical Logic
The tool begins by calculating a Linear Regression line. It looks back at a user-defined number of hours to analyze the "best fit" line for the price action. This involves calculating the relationship between time and closing prices to establish a baseline trajectory of where the market has been moving.
Identifying Market Dynamics
Once the baseline trend is established, the script splits the recent data into two segments (the past and the present). It then performs a detailed scan to identify "extreme" points in these segments:
- High-Point Analysis: It searches for the highest deviations above the regression line.
- Low-Point Analysis: It searches for the lowest deviations below the regression line.
The script uses a comparison logic to decide which of these behaviors is currently dominant. By measuring the distance and frequency of these peaks and valleys, it determines whether the market is exhibiting high-volatility behavior or following a more stable path.
Projection and Visualization
After identifying the most significant price drivers (the highs or lows), the script performs a predictive calculation. It projects these extremes forward into the future. Specifically:
- Trend Projection: It calculates where the current price trend is headed based on the identified high/low points.
- Multi-Level Mapping: Rather than just drawing one line, it creates three distinct projected paths:
- An upper boundary.
- A median (middle) path.
- A lower boundary.
Visual Output
The results are rendered on your chart as three dotted lines. These lines originate from the historical data point at the start of your chosen timeframe and extend to the current moment. This allows you to see a visual representation of the "expected" price corridor, helping you identify whether the current market price is overextended relative to its statistical trend or if it is moving within an expected range.
#property  copyright "ANG3110@latchess.com"
//----------------------------------
#property indicator_chart_window
//----------------------------------
extern int Hours=24;
extern color col=Blue;
//------------------
double lr,lr0,lrp;
double sx,sy,sxy,sx2,aa,bb;
int p,sName,fs;
int f,f0,f1;
double dh,dl,dh_1,dl_1,dh_2,dl_2;
int ai_1,ai_2,bi_1,bi_2;
double hai,lai,dhi,dli,dhm,dlm,ha0,hap,la0,lap;
double price_p1,price_p0,price_p2,price_01,price_00,price_02;
int p1,p0,p2,fp;
//*****************************************
int init() {
p=Hours*1440/Period();
if (fs==0) {sName=CurTime(); fs=1;}
return(0);}
//*******************************
int deinit() {
   ObjectDelete("1"+sName);
   ObjectDelete("0"+sName);
   ObjectDelete("2"+sName); }
//*******************************
int start() {
int i,n;
//------------------------------------------------------------------------------
if (f==1) {
p1=iBarShift(Symbol(),Period(),ObjectGet("1"+sName,OBJPROP_TIME1));
p0=iBarShift(Symbol(),Period(),ObjectGet("0"+sName,OBJPROP_TIME1));
p2=iBarShift(Symbol(),Period(),ObjectGet("2"+sName,OBJPROP_TIME1));
if (fp==0 && p!=p1) {p=p1; fp=1;}
if (fp==0 && p!=p0) {p=p0; fp=1;}
if (fp==0 && p!=p2) {p=p2; fp=1;}
}
//====================================================
sx=0; sy=0; sxy=0; sx2=0;
for (n=0; n<=p; n++) {sx+=n; sy+=Close[n]; sxy+=n*Close[n]; sx2+=MathPow(n,2);}
aa=(sx*sy-(p+1)*sxy)/(MathPow(sx,2)-(p+1)*sx2); bb=(sy-aa*sx)/(p+1);
//----------------------------------------------------
for (i=0; i<=p; i++) {
lr=bb+aa*i;
dh=High[i]-lr; dl=Low[i]-lr;
//----------------------------------------------------
if (i<p/2) {if (i==0) {dh_1=0.0; dl_1=0.0; ai_1=i; bi_1=i;}
if (dh>=dh_1) {dh_1=dh; ai_1=i;}
if (dl<=dl_1) {dl_1=dl; bi_1=i;}}
//----------------------------------------------------
if (i>=p/2) {if (i==p/2) {dh_2=0.0; dl_2=0.0; ai_2=i; bi_2=i;}
if (dh>=dh_2) {dh_2=dh; ai_2=i;}
if (dl<=dl_2) {dl_2=dl; bi_2=i;}}}
//-------------------------------------
lr0=bb; lrp=bb+aa*(i+p);
//===================================================
if (MathAbs(ai_1-ai_2)>MathAbs(bi_1-bi_2)) f=1;
if (MathAbs(ai_1-ai_2)<MathAbs(bi_1-bi_2)) f=2;
if (MathAbs(ai_1-ai_2)==MathAbs(bi_1-bi_2)) {if (MathAbs(dh_1-dh_2)<MathAbs(dl_1-dl_2)) f=1; if (MathAbs(dh_1-dh_2)>=MathAbs(dl_1-dl_2)) f=2;}
//=================================================
if (f==1) {
for (n=0; n<=20; n++) { f1=0;
for (i=0; i<=p; i++) {hai=High[ai_1]*(i-ai_2)/(ai_1-ai_2)+High[ai_2]*(i-ai_1)/(ai_2-ai_1);
if (i==0 || i==p/2) dhm=0.0;
if (High[i]-hai>dhm && i<p/2) {ai_1=i; f1=1;}
if (High[i]-hai>dhm && i>=p/2) {ai_2=i; f1=1;} }
if (f==0) break;}
//----------------------------
for (i=0; i<=p; i++) {hai=High[ai_1]*(i-ai_2)/(ai_1-ai_2)+High[ai_2]*(i-ai_1)/(ai_2-ai_1);
dli=Low[i]-hai;
if (i==0) dlm=0.0; if (dli<dlm) dlm=dli;}
ha0=High[ai_1]*(0-ai_2)/(ai_1-ai_2)+High[ai_2]*(0-ai_1)/(ai_2-ai_1);
hap=High[ai_1]*(p-ai_2)/(ai_1-ai_2)+High[ai_2]*(p-ai_1)/(ai_2-ai_1);
//----------------------------
price_p1=hap;
price_p0=hap+dlm/2;
price_p2=hap+dlm;
price_01=ha0;
price_00=ha0+dlm/2;
price_02=ha0+dlm;
}
//=================================================
if (f==2) {
for (n=0; n<=20; n++) { f1=0;
for (i=0; i<=p; i++) {lai=Low[bi_1]*(i-bi_2)/(bi_1-bi_2)+Low[bi_2]*(i-bi_1)/(bi_2-bi_1);
if (i==0 || i==p/2) dlm=0.0;
if (Low[i]-lai<dlm && i<p/2) {bi_1=i; f1=1;}
if (Low[i]-lai<dlm && i>=p/2) {bi_2=i; f1=1;}}
if (f==0) break;}
//----------------------------
for (i=0; i<=p; i++) {lai=Low[bi_1]*(i-bi_2)/(bi_1-bi_2)+Low[bi_2]*(i-bi_1)/(bi_2-bi_1);
dhi=High[i]-lai;
if (i==0) dhm=0.0; if (dhi>dhm) dhm=dhi;}
la0=Low[bi_1]*(0-bi_2)/(bi_1-bi_2)+Low[bi_2]*(0-bi_1)/(bi_2-bi_1);
lap=Low[bi_1]*(p-bi_2)/(bi_1-bi_2)+Low[bi_2]*(p-bi_1)/(bi_2-bi_1);
//----------------------------------------------------------------
price_p1=lap;
price_p0=lap+dhm/2;
price_p2=lap+dhm;
price_01=la0;
price_00=la0+dhm/2;
price_02=la0+dhm;
}
//===================================================================================
ObjectCreate("1"+sName,2, 0,Time[p],price_p1,Time[0],price_01);
ObjectCreate("0"+sName,2, 0,Time[p],price_p0,Time[0],price_00);
ObjectCreate("2"+sName,2, 0,Time[p],price_p2,Time[0],price_02);
//-----------------------------------------------------------------
ObjectSet("1"+sName,OBJPROP_COLOR,col);
ObjectSet("0"+sName,OBJPROP_COLOR,col);
ObjectSet("0"+sName,OBJPROP_STYLE,STYLE_DOT);
ObjectSet("2"+sName,OBJPROP_COLOR,col);
//---------------------------------------------
ObjectSet("1"+sName,OBJPROP_TIME1,Time[p]);
ObjectSet("1"+sName,OBJPROP_PRICE1,price_p1);
ObjectSet("1"+sName,OBJPROP_TIME2,Time[0]);
ObjectSet("1"+sName,OBJPROP_PRICE2,price_01);
ObjectSet("0"+sName,OBJPROP_TIME1,Time[p]);
ObjectSet("0"+sName,OBJPROP_PRICE1,price_p0);
ObjectSet("0"+sName,OBJPROP_TIME2,Time[0]);
ObjectSet("0"+sName,OBJPROP_PRICE2,price_00);
ObjectSet("2"+sName,OBJPROP_TIME1,Time[p]);
ObjectSet("2"+sName,OBJPROP_PRICE1,price_p2);
ObjectSet("2"+sName,OBJPROP_TIME2,Time[0]);
ObjectSet("2"+sName,OBJPROP_PRICE2,price_02);
//==================================================================
f=1; p1=p; p0=p; p2=p; fp=0;
//*************************************************************************************
return(0);}
//=====================================================================================
Comments