i-GentorCCIM_v[1].0.2
Download script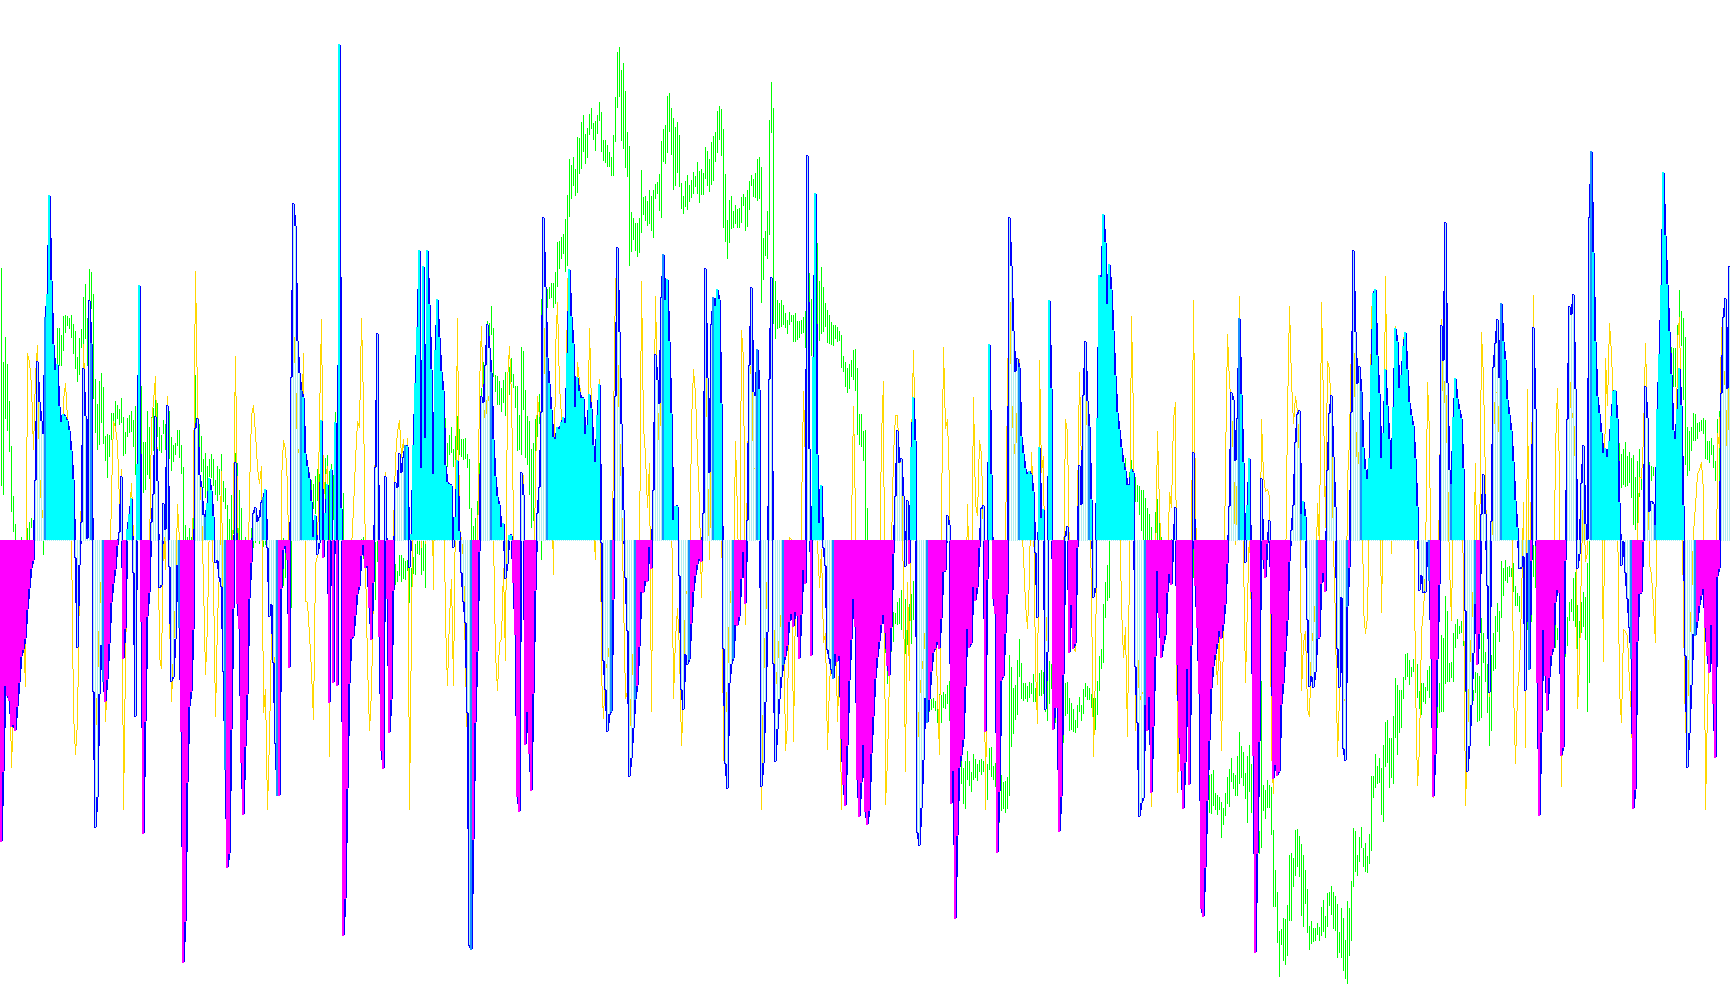
The i-GentorCCIM is a specialized technical analysis tool designed to help traders visualize market momentum and identify trend shifts by processing price data into multiple visual layers. Instead of looking at a single price point, this script analyzes the relationship between different "speeds" of market movement.
Core Logic and Functionality
Dual-Speed Momentum Tracking The tool works by calculating two different versions of the Commodity Channel Index (CCI), which is an oscillator used to measure how far the current price is deviating from its average.
- Fast CCI: Reacts quickly to immediate price fluctuations, helping to capture short-term movements.
- Slow CCI: Provides a smoother, more stable view of the market direction by averaging data over a longer period.
Trend Identification and Visual Feedback The script uses these two speeds to provide a multi-layered visual experience:
- Trend Coloring: The tool automatically identifies whether the market is in an upward or downward phase. It highlights these trends visually, allowing you to see at a glance whether the broader momentum is positive (bullish) or negative (bearish).
- Dynamic Histogram: A histogram component tracks the movement of the slow momentum. This helps users filter out "market noise" and focus on the primary direction of the price action.
Signal Mechanics One of the core features of this script is its internal counter system, which monitors the "rhythm" of the market:
- Crossing Detection: The logic monitors when the momentum shifts from positive to negative (or vice versa).
- Delayed Signal Confirmation: Rather than reacting instantly to every tiny wiggle in price, the script uses a sequence-based logic. It waits for a specific number of consecutive movements or conditions to be met before validating a "Signal Bar." This is designed to help filter out false signals and ensure that the detected trend has enough strength to be considered significant.
Summary for the User
Essentially, this tool acts as a "momentum filter." It takes complex price data and boils it down into three clear visual components:
- The immediate pulse of the market (Fast CCI).
- The long-term direction of the market (Slow CCI/Histogram).
- Trend confirmations, which highlight exactly when the market momentum has shifted enough to warrant attention, helping you stay on the right side of a moving trend.
//+------------------------------------------------------------------+
//|                                           i-GentorCCIM_v.0.2.mq4 |
//|                                                  Egorov Gennadiy |
//| 2005.08.20 KimIV  v.0.0                                          |
//| Íåìíîãî ìîäåðíèçèðîâàë, äîáàâèâ LSMA è ïîìåíÿâ å¸ ìåñòàìè ñ ÅÌÀ  |
//| 2005.08.20 KimIV  v.0.1                                          |
//| Îñâîáîäèë îäèí áóôåð                                             |
//| 2005.08.20 KimIV  v.0.2                                          |
//| Óáðàë LSMA è EMA.                                                |
//| Ñäåëàë ñèãíàëüíûé øåñòîé áàð è òðåíäîâóþ ðàñêðàñêó               |
//+------------------------------------------------------------------+
#property copyright "Egorov Gennadiy, FX Sniper, KimIV"
#property link      "http://www.kimiv.ru"

#property indicator_separate_window
#property indicator_buffers 6

#property indicator_color1 Red
#property indicator_color2 Black
#property indicator_color3 Silver
#property indicator_color4 Yellow
#property indicator_color5 Lime
#property indicator_color6 Red

#property indicator_level1 300
#property indicator_level2 200
#property indicator_level3 100
#property indicator_level4 50
#property indicator_level5 -50
#property indicator_level6 -100
#property indicator_level7 -200
#property indicator_level8 -300

//------- Âíåøíèå ïàðàìåòðû ------------------------------------------
extern int SlowCCIPeriod = 14;  // Ïåðèîä ìåäëåííîãî CCI
extern int FastCCIPeriod = 6;   // Ïåðèîä áûñòðîãî CCI

//------- Áóôåðû èíäèêàòîðà ------------------------------------------
double FastCCI[];
double SlowCCI[];
double HistCCI[];
double SignalBar[];
double TrendUp[];
double TrendDown[];

//------- Ãëîáàëüíûå ïåðåìåííûå --------------------------------------
bool fct=False, fup=False, fdn=False;
int ss=1;

//+------------------------------------------------------------------+
//| Custom indicator initialization function                         |
//+------------------------------------------------------------------+
void init() {
  IndicatorDigits(2);

  SetIndexStyle (0, DRAW_LINE, STYLE_SOLID, 1);
  SetIndexBuffer(0, FastCCI);
  SetIndexStyle (1, DRAW_LINE, STYLE_SOLID, 2);
  SetIndexBuffer(1, SlowCCI);
  SetIndexStyle (2, DRAW_HISTOGRAM, STYLE_SOLID, 1);
  SetIndexBuffer(2, HistCCI);
  SetIndexStyle (3, DRAW_HISTOGRAM, STYLE_SOLID, 2);
  SetIndexBuffer(3, SignalBar);
  SetIndexStyle (4, DRAW_HISTOGRAM, STYLE_SOLID, 2);
  SetIndexBuffer(4, TrendUp);
  SetIndexStyle (5, DRAW_HISTOGRAM, STYLE_SOLID, 2);
  SetIndexBuffer(5, TrendDown);
  Comment("");
}

//+------------------------------------------------------------------+
//| Custor indicator deinitialization function                       |
//+------------------------------------------------------------------+
void deinit() {
  Comment("");
}

//+------------------------------------------------------------------+
//| Custom indicator iteration function                              |
//+------------------------------------------------------------------+
int start() {
  int shift;
  int counted_bars=IndicatorCounted();

  if (counted_bars<0) return;
  if (counted_bars>0) counted_bars--;
//  for (shift=counted_bars; shift>=0; shift--) {
  for (shift=Bars; shift>=0; shift--) {
    TrendUp[shift] = 0;
    TrendDown[shift] = 0;
    FastCCI[shift] = iCCI(NULL, 0, FastCCIPeriod, PRICE_TYPICAL, shift);
    SlowCCI[shift] = iCCI(NULL, 0, SlowCCIPeriod, PRICE_TYPICAL, shift);
    HistCCI[shift] = SlowCCI[shift];
    if (HistCCI[shift+1]*HistCCI[shift]<0) {
      if (ss<=3) {
        if ((fup && HistCCI[shift]>0)
        || (fdn && HistCCI[shift]<0)) fct = True;
      } else fct = False;
      ss = 1;
    }
    if (ss==6) SignalBar[shift] = HistCCI[shift];
    else SignalBar[shift] = 0;
    if (ss>6 || fct) {
      if (HistCCI[shift]>=0) {
        TrendUp[shift] = HistCCI[shift];
        fup = True; fdn = False;
      } else {
        TrendDown[shift] = HistCCI[shift];
        fdn = True; fup = False;
      }
    }
    ss++;
  }
}
//+------------------------------------------------------------------+
Comments