i-GentorLSMA&EMA_v[1].0.2_v1
Download script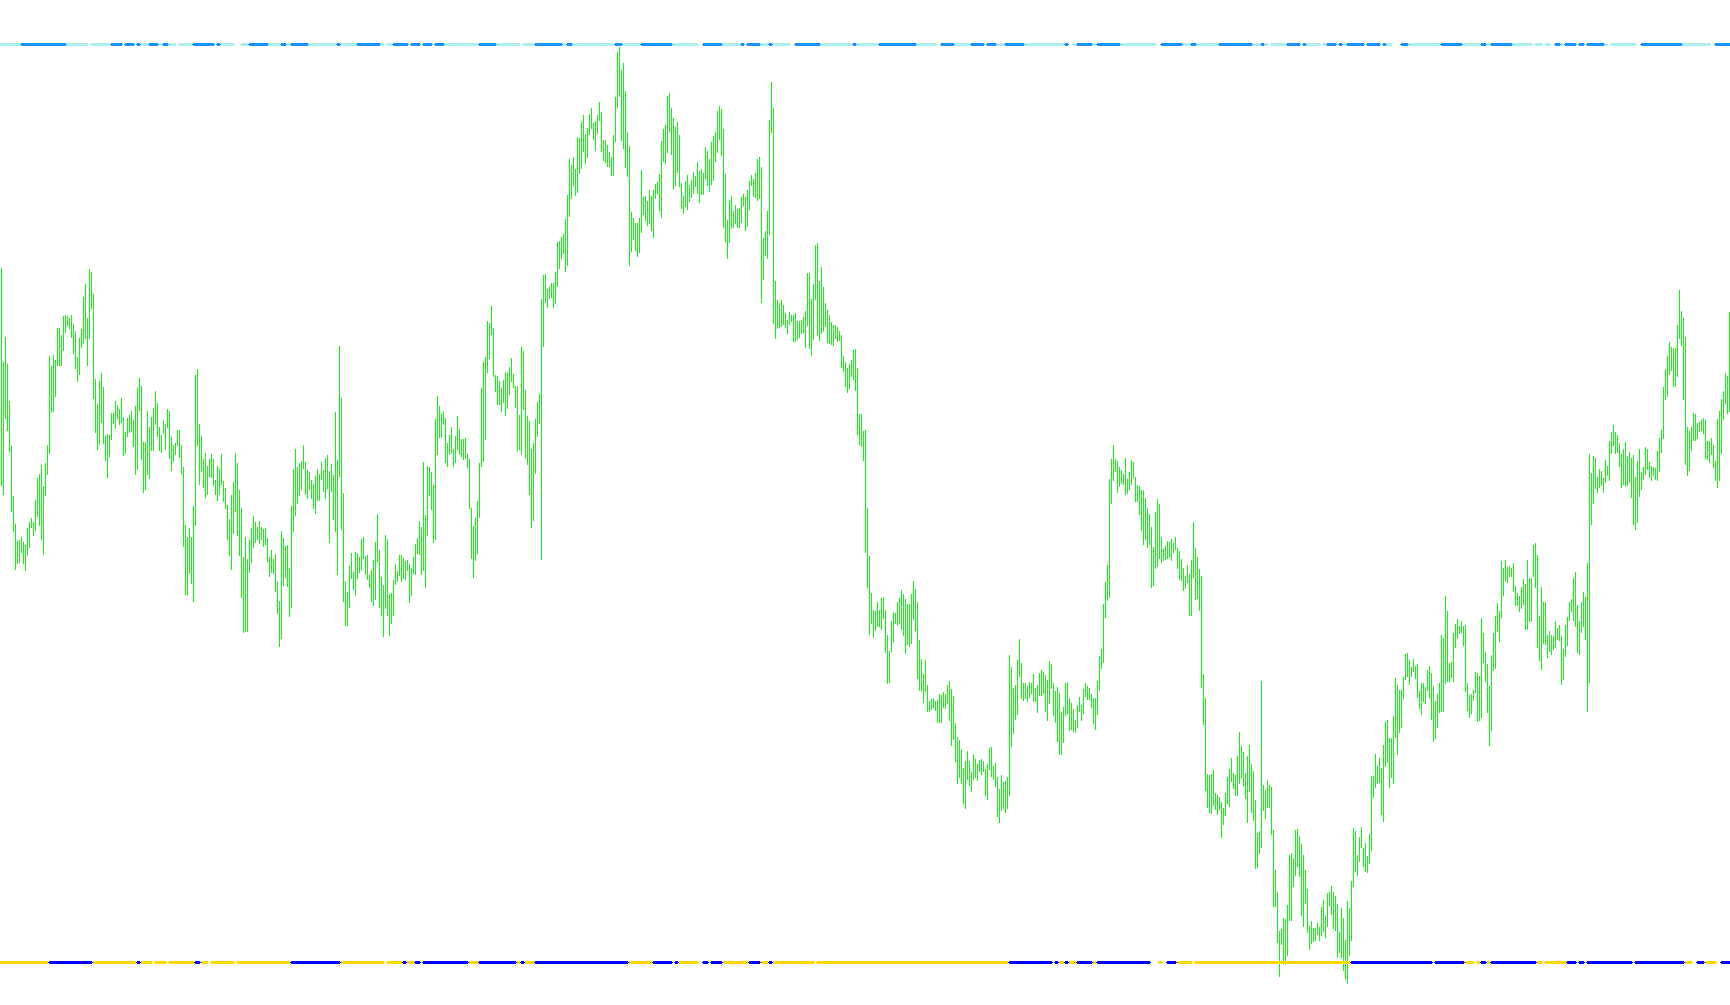
This technical tool is designed to provide traders with a visual representation of market momentum and price trends by analyzing the relationship between current prices and two distinct types of moving averages. By filtering out "noise" and highlighting specific price actions, it helps identify potential entry points or trend reversals.
Core Logic and Components
The script operates based on two primary analytical layers:
1. Dynamic Trend Filtering (EMA Analysis) The tool utilizes an Exponential Moving Average (EMA) to establish a baseline for the market's current direction. Unlike simple averages, this method gives more weight to recent price action, making it more responsive to sudden market shifts.
- High-Side Tracking: The indicator monitors when the closing price stays consistently above this moving average, signaling bullish sentiment (upward pressure).
- Low-Side Tracking: Conversely, it monitors when the price drops below the average, indicating bearish sentiment (downward pressure).
2. Weighted Volume Dynamics (LSMA Analysis) The second layer of logic uses a Linearly Weighted Moving Average (LSMA). This calculation is more sophisticated than a standard average because it assigns progressively higher weights to the most recent data points.
- Weighted Momentum: By calculating the sum of prices multiplied by their position in time, the script determines a "weighted" price level.
- Relative Position Analysis: The indicator compares the current market price against this weighted calculation. It identifies specific moments where the price is "overextended" relative to its weighted average.
How it Works Together
Instead of simply drawing continuous lines that can clutter a chart, this script acts as a selective filter. It only triggers visual markers when specific conditions are met:
- Momentum Confirmation: The script evaluates whether the current price is positioned above or below the weighted moving average.
- Visual Signaling: By using these two different types of averages (one responsive to recent trends and one heavily weighted by the most recent data), the tool highlights areas where the price is breaking away from its "normal" path.
Summary for the User
In practical terms, this script helps you visualize where the market is finding strength and where it might be losing steam. It filters out the background noise of the market to highlight specific moments where the price action confirms a trend or signals a potential shift in momentum based on both historical data and immediate price behavior.
/*-----------------------------+
|			       |
| Shared by www.Aptrafx.com    |
|			       |
+------------------------------*/

//+------------------------------------------------------------------+
//|                                       i-GentorLSMA&EMA_v.0.2.mq4 |
//|                                                 FX Sniper, KimIV |
//| 2005.08.20 KimIV  v.0.0                                          |
//| Ñîåäèíèë â LSMA è EMA                                            |
//| 2005.08.20 KimIV  v.0.2                                          |
//| Ñèíõðîíèçèðîâàë íóìåðàöèþ âåðñèé ñ i-GentorCCIM_v.0.2.mq4        |
//+------------------------------------------------------------------+
#property copyright "FX Sniper, KimIV"
#property link      "http://www.kimiv.ru"

#property indicator_separate_window
#property indicator_buffers 4

#property indicator_color1 Yellow
#property indicator_color2 Blue
#property indicator_color3 Red
#property indicator_color4 Lime

//---- Âíåøíèå ïàðàìåòðû ---------------------------------------------
extern int EMAPeriod  = 34;  // Ïåðèîä ÅÌÀ
extern int LSMAPeriod = 25;  // Ïåðèîä LSMA

//---- Áóôåðû èíäèêàòîðà ---------------------------------------------
double LineHighEMA[];
double LineLowEMA[];
double LSMABuffer1[];
double LSMABuffer2[];

//+------------------------------------------------------------------+
//| Custom indicator initialization function                         |
//+------------------------------------------------------------------+
void init() {
  IndicatorDigits(2);

  SetIndexStyle (0, DRAW_LINE, STYLE_SOLID, 3);
  SetIndexBuffer(0, LineHighEMA);
  SetIndexStyle (1, DRAW_LINE, STYLE_SOLID, 3);
  SetIndexBuffer(1, LineLowEMA);
  SetIndexBuffer(2, LSMABuffer1);
  SetIndexStyle (2, DRAW_LINE, STYLE_SOLID, 3);
  SetIndexBuffer(3, LSMABuffer2);
  SetIndexStyle (3, DRAW_LINE, STYLE_SOLID, 3);
  Comment("");
}

//+------------------------------------------------------------------+
//| Custor indicator deinitialization function                       |
//+------------------------------------------------------------------+
void deinit() {
  Comment("");
}

//+------------------------------------------------------------------+
//| Custom indicator iteration function                              |
//+------------------------------------------------------------------+
int start() {
  int i, shift, counted_bars = IndicatorCounted();
  int Draw4HowLong, loopbegin;
  double sum, lengthvar, tmp, wt;

  if (counted_bars<0) return;
  if (counted_bars>0) counted_bars--;
  counted_bars = Bars - counted_bars;
  for (shift=0; shift<counted_bars; shift++) {
    LineLowEMA[shift] = -1;
    LineHighEMA[shift] = -1;

    double EmaValue = iMA(NULL, 0, EMAPeriod, 0, MODE_EMA, PRICE_TYPICAL, shift);
    if (Close[shift] > EmaValue) LineHighEMA[shift] = EMPTY_VALUE;
    else
      if (Close[shift] < EmaValue) LineLowEMA[shift] = EMPTY_VALUE;
  }

  Draw4HowLong = Bars-LSMAPeriod - 5;
  loopbegin = Draw4HowLong - LSMAPeriod - 1;

  for(shift=loopbegin; shift>=0; shift--) {
    sum = 0;
    for (i=LSMAPeriod; i>=1; i--) {
      lengthvar = LSMAPeriod + 1;
      lengthvar /= 3;
      tmp = 0;
      tmp = (i - lengthvar)*Close[LSMAPeriod-i+shift];
      sum+=tmp;
    }
    wt = sum*6/(LSMAPeriod*(LSMAPeriod+1));

    LSMABuffer1[shift] = 1;
    LSMABuffer2[shift] = 1;

    if (wt > Close[shift]) LSMABuffer2[shift] = EMPTY_VALUE;
    else
      if (wt < Close[shift]) LSMABuffer1[shift] = EMPTY_VALUE;
  }
}
//+------------------------------------------------------------------+
Comments