i-GentorLSMA&EMA_v[1].0.2_v2
Download script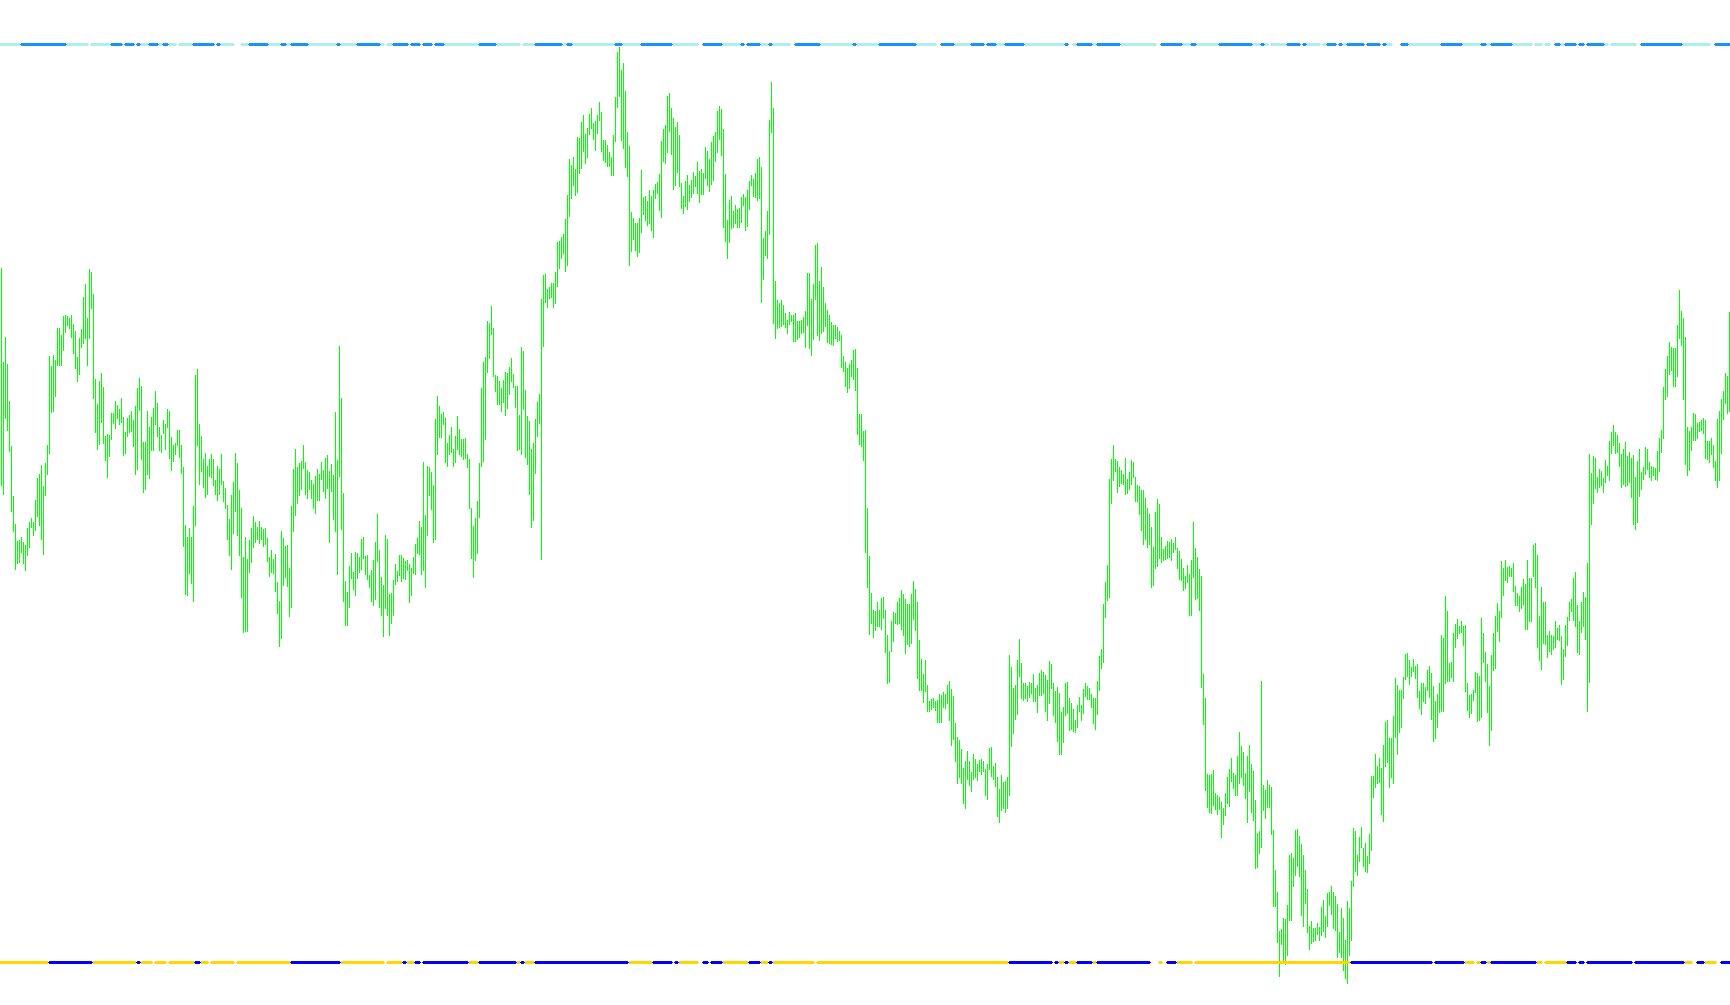
This custom trading indicator is designed to provide visual signals by analyzing price action relative to two distinct types of moving averages: the Exponential Moving Average (EMA) and the Least Squares Moving Average (LSMA). Instead of simply showing lines that follow the price, this tool acts as a filter to identify specific market conditions.
Core Logic and Functionality
The script processes market data to generate visual cues based on two primary mathematical components:
1. Exponential Moving Average (EMA) Filtering The tool calculates a standard EMA based on a user-defined period. It monitors the relationship between the current closing price and this average. The logic is designed to identify whether the price is currently trending above or below this specific moving average threshold. By establishing this "high" and "low" boundary, the indicator helps traders visualize the general direction of the trend.
2. Least Squares Moving Average (LSMA) Dynamics In addition to the EMA, the script calculates an LSMA. Unlike standard averages that weigh recent data more heavily, the LSMA uses a linear regression calculation to project where the price "should" be based on its current trajectory. The logic evaluates the closing price against this calculated weighted value.
Visual Output and Interpretation
The indicator operates in a separate window and produces four distinct visual components:
- Trend Identification: By comparing the current price to the EMA, the tool highlights whether the market is maintaining strength above a mean or retreating below it.
- Momentum and Deviation: The LSMA component provides a secondary layer of analysis. It checks if the price has deviated significantly from its linear path.
- Dynamic Signal Plotting: Rather than drawing continuous lines for every data point, the script uses "empty value" logic. This means that signals only appear on the chart when specific conditions are met—namely, when the price crosses certain thresholds relative to the calculated averages.
Summary for the User
Essentially, this tool acts as a sophisticated trend-confirmation system. It combines two different mathematical philosophies: the EMA, which prioritizes recent momentum, and the LSMA, which looks at the linear trajectory of the market. By using both, the indicator helps traders filter out "noise" and focus on clear price movements where the current market action aligns with established mathematical averages.
//+------------------------------------------------------------------+
//|                                       i-GentorLSMA&EMA_v.0.2.mq4 |
//|                                                 FX Sniper, KimIV |
//| 2005.08.20 KimIV  v.0.0                                          |
//| Ñîåäèíèë â LSMA è EMA                                            |
//| 2005.08.20 KimIV  v.0.2                                          |
//| Ñèíõðîíèçèðîâàë íóìåðàöèþ âåðñèé ñ i-GentorCCIM_v.0.2.mq4        |
//+------------------------------------------------------------------+
#property copyright "FX Sniper, KimIV"
#property link      "http://www.kimiv.ru"
//----
#property indicator_separate_window
#property indicator_buffers 4
#property indicator_color1 Yellow
#property indicator_color2 Blue
#property indicator_color3 Red
#property indicator_color4 Lime
//---- Âíåøíèå ïàðàìåòðû ---------------------------------------------
extern int EMAPeriod =34;  // Ïåðèîä ÅÌÀ
extern int LSMAPeriod=25;  // Ïåðèîä LSMA
//---- Áóôåðû èíäèêàòîðà ---------------------------------------------
double LineHighEMA[];
double LineLowEMA[];
double LSMABuffer1[];
double LSMABuffer2[];
//+------------------------------------------------------------------+
//| Custom indicator initialization function                         |
//+------------------------------------------------------------------+
  void init()
  {
   IndicatorDigits(2);
   SetIndexStyle (0, DRAW_LINE, STYLE_SOLID, 3);
   SetIndexBuffer(0, LineHighEMA);
   SetIndexStyle (1, DRAW_LINE, STYLE_SOLID, 3);
   SetIndexBuffer(1, LineLowEMA);
   SetIndexBuffer(2, LSMABuffer1);
   SetIndexStyle (2, DRAW_LINE, STYLE_SOLID, 3);
   SetIndexBuffer(3, LSMABuffer2);
   SetIndexStyle (3, DRAW_LINE, STYLE_SOLID, 3);
   Comment("");
  }
//+------------------------------------------------------------------+
//| Custor indicator deinitialization function                       |
//+------------------------------------------------------------------+
  void deinit()
  {
   Comment("");
  }
//+------------------------------------------------------------------+
//| Custom indicator iteration function                              |
//+------------------------------------------------------------------+
  int start()
  {
   int i, shift, counted_bars=IndicatorCounted();
   int Draw4HowLong, loopbegin;
   double sum, lengthvar, tmp, wt;
//----
   if (counted_bars<0) return;
   if (counted_bars>0) counted_bars--;
   counted_bars=Bars - counted_bars;
     for(shift=0; shift<counted_bars; shift++)
     {
      LineLowEMA[shift]=-1;
      LineHighEMA[shift]=-1;
//----
      double EmaValue=iMA(NULL, 0, EMAPeriod, 0, MODE_EMA, PRICE_TYPICAL, shift);
      if (Close[shift] > EmaValue) LineHighEMA[shift]=EMPTY_VALUE;
      else
         if (Close[shift] < EmaValue) LineLowEMA[shift]=EMPTY_VALUE;
     }
   Draw4HowLong=Bars-LSMAPeriod - 5;
   loopbegin=Draw4HowLong - LSMAPeriod - 1;
//----
     for(shift=loopbegin; shift>=0; shift--)
     {
      sum=0;
        for(i=LSMAPeriod; i>=1; i--)
        {
         lengthvar=LSMAPeriod + 1;
         lengthvar/=3;
         tmp=0;
         tmp=(i - lengthvar)*Close[LSMAPeriod-i+shift];
         sum+=tmp;
        }
      wt=sum*6/(LSMAPeriod*(LSMAPeriod+1));
//----
      LSMABuffer1[shift]=1;
      LSMABuffer2[shift]=1;
//----
      if (wt > Close[shift]) LSMABuffer2[shift]=EMPTY_VALUE;
      else
         if (wt < Close[shift]) LSMABuffer1[shift]=EMPTY_VALUE;
     }
  }
//+------------------------------------------------------------------+
Comments