i-Regr H&L
Download script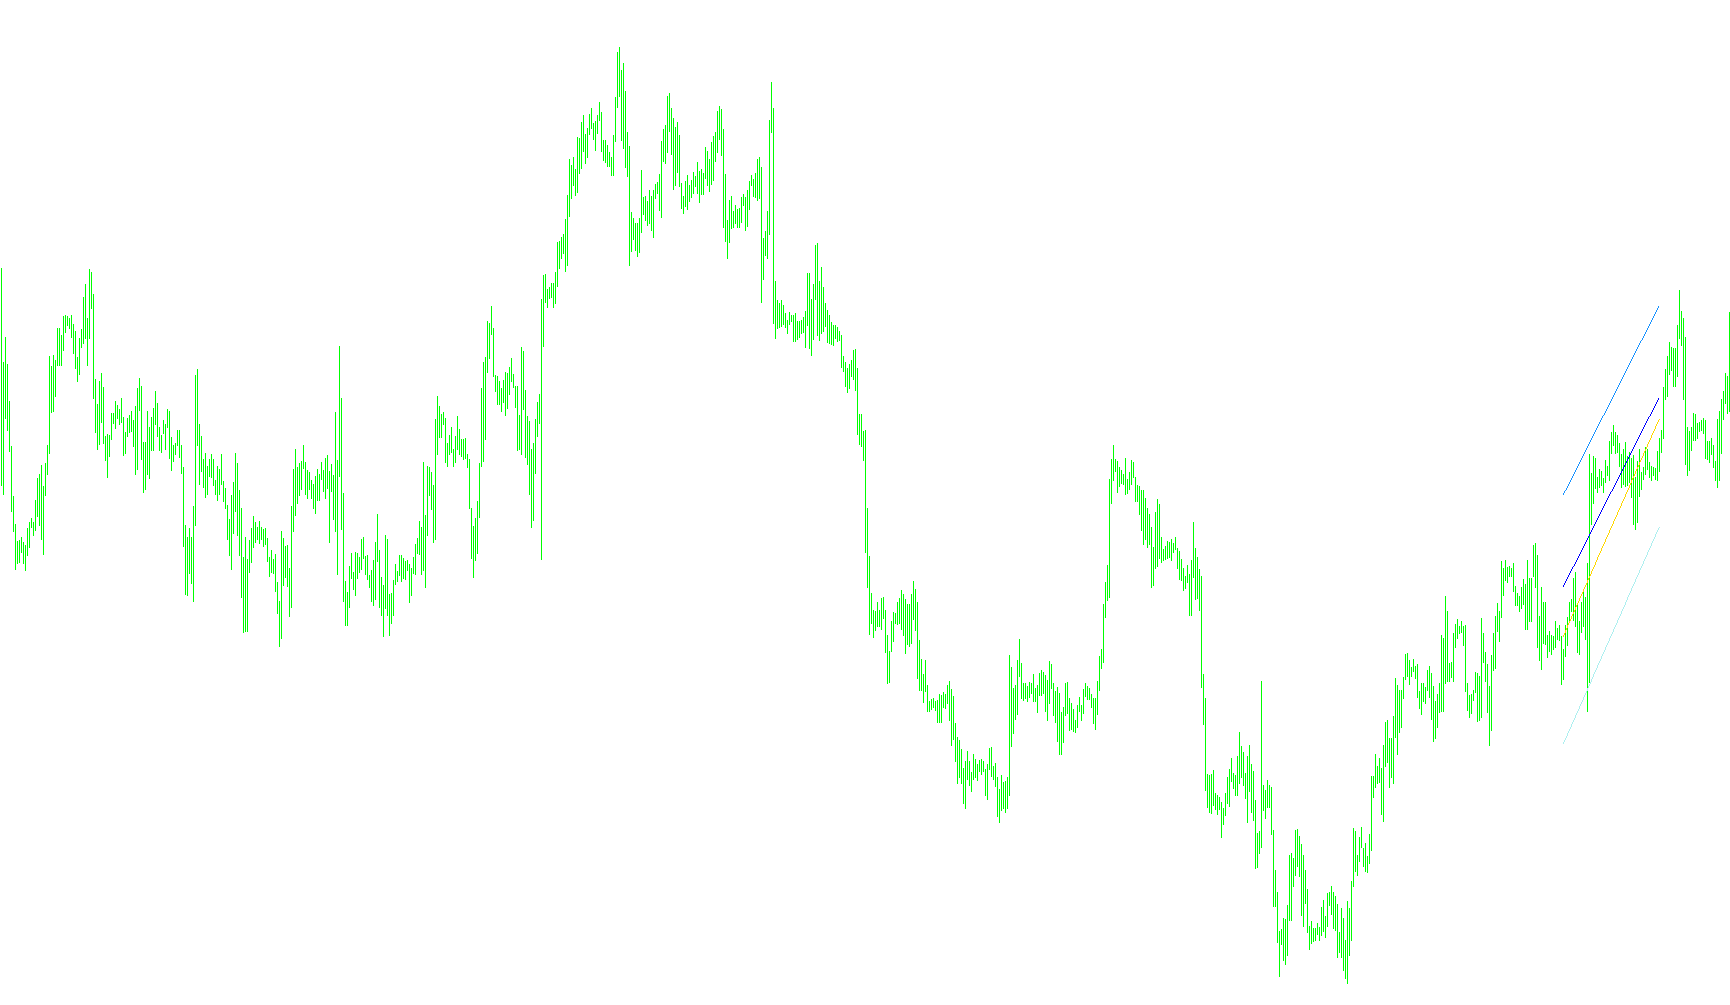
This script is designed to provide a sophisticated visual analysis of market price action by identifying the underlying "shape" or trend of the data. Unlike standard indicators that simply follow the price, this tool uses a mathematical approach to model how prices are behaving over a specific period.
Core Logic and Methodology
1. Mathematical Trend Modeling (Regression) The script utilizes a method known as "Polynomial Regression." Instead of drawing a straight line through the price, it calculates a curved path that best fits the historical data points provided in your settings (defined by the "degree" parameter). By determining this curve, the tool can distinguish between actual market trends and minor "noise" or random fluctuations.
2. High and Low Price Analysis The logic works independently on two sides of the market:
- Upper Boundary: It analyzes the High prices to create a smoothed upper trend line.
- Lower Boundary: It analyzes the Low prices to create a smoothed lower trend line.
By treating these separately, the script can visualize the "corridor" in which the price is currently moving.
3. Dynamic Variance Calculation (Standard Deviation) To make the boundaries useful for trading, the script calculates the "Standard Deviation" of the price relative to the regression curves. This essentially measures how far the price typically wanders away from the average trend.
- It calculates the variance between the actual highs/lows and the calculated regression lines.
- It then applies a multiplier (the "kstd" setting) to project an outer boundary.
4. Visual Output The final result is a set of four visual lines on your chart:
- The Core Trend: Two lines representing the smooth, mathematical path of the recent price highs and lows.
- The Outer Channels: Two wider boundaries that represent the extreme limits of the current trend based on volatility.
How it functions for the user
Instead of just seeing where the price is, this script shows you the "mathematical lane" the price is likely to stay within based on recent history. When the price stays within these channels, it suggests a stable trend; when it pushes against or breaks out of these boundaries, it indicates significant volatility or a potential change in market direction.
//+------------------------------------------------------------------+
//|                                                   i-Regr H&L.mq4 |
//|                                         Copyright © 2008, Kharko |
//|                                                                  |
//+------------------------------------------------------------------+
#property copyright "Copyright © 2008, Kharko"
#property link      ""

//----
#property indicator_chart_window
#property indicator_buffers 4
#property indicator_color1 LimeGreen
#property indicator_color2 LimeGreen
#property indicator_color3 Gold
#property indicator_color4 Gold


extern int degree = 1;
extern double kstd = 2.0;
extern int bars = 48;
extern int shift = 0;


//-----
double fxl[],fxh[],sqh[],sql[];

double ai[10,10],b[10],c[10],x[10],y[10],sx[20];
double sum,suml,sumh;
int ip,p,n,f;
double qq,mm,tt;
int ii,jj,kk,ll,nn;

int i0 = 0;
datetime
      prevtime1=0;

//+------------------------------------------------------------------+
//| Custom indicator initialization function                         |
//+------------------------------------------------------------------+
int init()
{
  SetIndexBuffer(0, fxl); // Áóôåðû ìàññèâîâ èíäèêàòîðà
  SetIndexBuffer(1, fxh);
  SetIndexBuffer(2, sql);
  SetIndexBuffer(3, sqh);

  SetIndexStyle(0, DRAW_LINE);
  SetIndexStyle(1, DRAW_LINE);
  SetIndexStyle(2, DRAW_LINE);
  SetIndexStyle(3, DRAW_LINE);

  SetIndexEmptyValue(0, 0.0);
  SetIndexEmptyValue(1, 0.0);
  SetIndexEmptyValue(2, 0.0);
  SetIndexEmptyValue(3, 0.0);

  SetIndexShift(0, shift);
  SetIndexShift(1, shift);
  SetIndexShift(2, shift);
  SetIndexShift(3, shift);

  return(0);
}

//+------------------------------------------------------------------+
//| Custom indicator deinitialization function                       |
//+------------------------------------------------------------------+
int deinit()
{
  return(0);
}

//+------------------------------------------------------------------+
//| Custom indicator iteration function                              |
//+------------------------------------------------------------------+
int start()
{
  if (Bars < bars) return;
   if(prevtime1==iTime(NULL,0,0))
   {
      prevtime1=iTime(NULL,0,0);
      return(0);
   }
   else
      prevtime1=iTime(NULL,0,0);
//----

  int mi; // ïåðåìåííàÿ èñïîëüçóþùàÿñÿ òîëüêî â start
  ip = bars;
  p=ip; // òèïà ïðèñâàèâàíèå
  sx[1]=p+1; // ïðèìå÷àíèå - [] - îçíà÷àåò ìàññèâ
  nn = degree+1;

  SetIndexDrawBegin(0, Bars-p-1);
  SetIndexDrawBegin(1, Bars-p-1);
  SetIndexDrawBegin(2, Bars-p-1);
  SetIndexDrawBegin(3, Bars-p-1);

//----------------------sx-------------------------------------------------------------------
  for(mi=1;mi<=nn*2-2;mi++) // ìàòåìàòè÷åñêîå âûðàæåíèå - äëÿ âñåõ mi îò 1 äî nn*2-2
  {
    sum=0;
    for(n=i0;n<=i0+p;n++)
    {
       sum+=MathPow(n,mi);
    }
    sx[mi+1]=sum;
  }
  //----------------------syx-----------
  for(mi=1;mi<=nn;mi++)
  {
    suml=0.00000;
    sumh=0.00000;
    for(n=i0;n<=i0+p;n++)
    {
       if(mi==1)
       {
         suml+=Low[n];
         sumh+=High[n];
       }
       else
       {
         suml+=Low[n]*MathPow(n,mi-1);
         sumh+=High[n]*MathPow(n,mi-1);
       }
    }
    b[mi]=suml;
    c[mi]=sumh;
  }
//===============Matrix=======================================================================================================
  for(jj=1;jj<=nn;jj++)
  {
    for(ii=1; ii<=nn; ii++)
    {
       kk=ii+jj-1;
       ai[ii,jj]=sx[kk];
    }
  }
//===============Gauss========================================================================================================
  for(kk=1; kk<=nn-1; kk++)
  {
    ll=0;
    mm=0;
    for(ii=kk; ii<=nn; ii++)
    {
       if(MathAbs(ai[ii,kk])>mm)
       {
          mm=MathAbs(ai[ii,kk]);
          ll=ii;
       }
    }
    if(ll==0) return(0);
    if (ll!=kk)
    {
       for(jj=1; jj<=nn; jj++)
       {
          tt=ai[kk,jj];
          ai[kk,jj]=ai[ll,jj];
          ai[ll,jj]=tt;
       }
       tt=b[kk];
       b[kk]=b[ll];
       b[ll]=tt;
       tt=c[kk];
       c[kk]=c[ll];
       c[ll]=tt;
    }
    for(ii=kk+1;ii<=nn;ii++)
    {
       qq=ai[ii,kk]/ai[kk,kk];
       for(jj=1;jj<=nn;jj++)
       {
          if(jj==kk) ai[ii,jj]=0;
          else ai[ii,jj]=ai[ii,jj]-qq*ai[kk,jj];
       }
       b[ii]=b[ii]-qq*b[kk];
       c[ii]=c[ii]-qq*c[kk];
    }
  }
  x[nn]=b[nn]/ai[nn,nn];
  y[nn]=c[nn]/ai[nn,nn];
  for(ii=nn-1;ii>=1;ii--)
  {
    mm=0;
    tt=0;
    for(jj=1;jj<=nn-ii;jj++)
    {
       mm=mm+ai[ii,ii+jj]*x[ii+jj];
       x[ii]=(1/ai[ii,ii])*(b[ii]-mm);
       tt=tt+ai[ii,ii+jj]*y[ii+jj];
       y[ii]=(1/ai[ii,ii])*(c[ii]-tt);
    }
  }
//===========================================================================================================================
  for(n=i0;n<=i0+p;n++)
  {
    suml=0;
    sumh=0;
    for(kk=1;kk<=degree;kk++)
    {
       suml+=x[kk+1]*MathPow(n,kk);
       sumh+=y[kk+1]*MathPow(n,kk);
    }
    fxl[n]=x[1]+suml;
    fxh[n]=y[1]+sumh;
  }
//-----------------------------------Std-----------------------------------------------------------------------------------
  suml=0;
  sumh=0;
  for(n=i0;n<=i0+p;n++)
  {
    suml+=MathPow(Low[n]-fxl[n],2);
    sumh+=MathPow(High[n]-fxh[n],2);
  }
  suml=MathSqrt(suml/(p+1))*kstd;
  sumh=MathSqrt(sumh/(p+1))*kstd;

  for(n=i0;n<=i0+p;n++)
  {
    sqh[n]=fxh[n]+sumh;
    sql[n]=fxl[n]-suml;
  }

  return(0);
}
//+------------------------------------------------------------------+
Comments