i-Regr H&L v2
Download script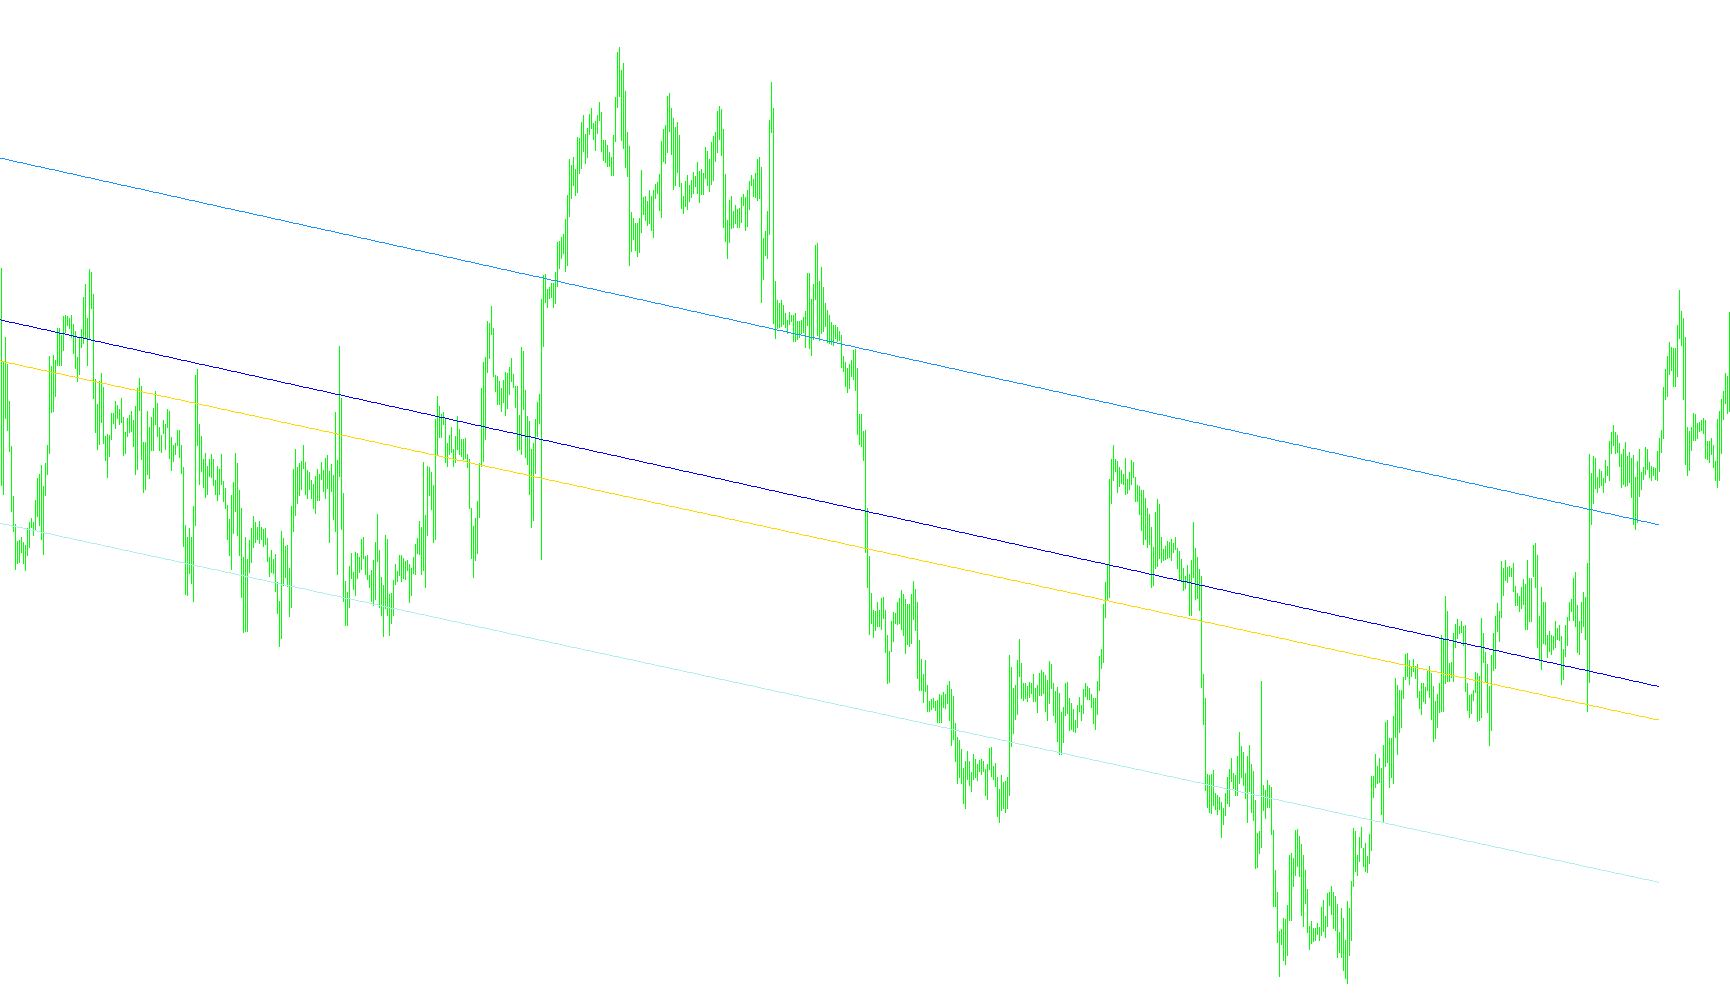
This script is a technical analysis tool designed to identify and visualize price trends on a trading chart by using advanced mathematical modeling. Instead of relying on simple moving averages or basic trend lines, it employs a sophisticated method known as polynomial regression to "smooth out" market noise and project potential price paths.
Here is a breakdown of the logic used by the script:
Data Collection and Scope
The tool begins by examining a specific window of historical price data (the number of bars). It looks specifically at the "High" and "Low" prices of each candle to establish the boundaries of market movement. The user can define a specific point in time or a specific look-back period to ensure the calculation is based on the relevant timeframe.
Mathematical Modeling (Regression)
The core of the script relies on complex linear algebra. It performs the following steps:
- Matrix Construction: It builds a mathematical matrix based on the "degree" setting. A higher degree allows the tool to follow more complex, curving price movements, while a lower degree keeps the lines smoother and more generalized.
- Gaussian Elimination: The script uses a process called Gaussian Elimination to solve a series of equations. This is essentially finding the "best fit" curve that minimizes the distance between the actual historical price points and the calculated trend line.
- Curve Fitting: By solving these equations, the script determines the coefficients needed to create two distinct curves: one for the lower boundary of the price action and one for the upper boundary.
Trend Visualization
Once the mathematical "best fit" is determined, the script renders four specific lines on your chart:
- The Upper and Lower Bounds: These represent the primary calculated trend paths.
- Standard Deviation Channels: The script calculates the "Standard Deviation"—a measure of how much the price typically fluctuates away from the average trend. It then projects a "buffer" zone above and below the main curves.
Practical Application
In non-technical terms, this tool helps you see the "skeleton" of the market. By stripping away the minor fluctuations (the noise) and highlighting the underlying curve, it allows you to see where the price is theoretically heading based on past behavior. The gold and lime lines provide a visual corridor; when prices stay within these boundaries, they are following the established trend, while breakouts from these boundaries can signal significant changes in market momentum.
//+------------------------------------------------------------------+
//|                                                   i-Regr H&L.mq4 |
//|                                         Copyright © 2008, Kharko |
//|                                                                  |
//+------------------------------------------------------------------+
#property copyright "Copyright © 2008, Kharko"
#property link      ""

//----
#property indicator_chart_window
#property indicator_buffers 4
#property indicator_color1 LimeGreen
#property indicator_color2 LimeGreen
#property indicator_color3 Gold
#property indicator_color4 Gold


extern int degree = 1; // Èçìåíÿåòñÿ îò 1 äî 61
extern double kstd = 1.0;
extern string data = "2009.02.25 16:00";  // Ñòðîêà â ôîðìàòå "yyyy.mm.dd hh:mi".
extern int bars = 48;
extern int shift = 0;


//-----
double fxl[],fxh[],sqh[],sql[];

double ai[][65],b[],c[],x[],y[],sx[];
double sum,suml,sumh;
int ip,p,n,f;
double qq,mm,tt;
int ii,jj,kk,ll,nn;

int i0 = 0;
datetime
      prevtime1=0;

//+------------------------------------------------------------------+
//| Custom indicator initialization function                         |
//+------------------------------------------------------------------+
int init()
{
  ArrayResize(ai,degree+2);
  ArrayResize(b,degree+2);
  ArrayResize(c,degree+2);
  ArrayResize(x,degree+2);
  ArrayResize(y,degree+2);
  ArrayResize(sx,2*(degree+3));

  SetIndexBuffer(0, fxl); // Áóôåðû ìàññèâîâ èíäèêàòîðà
  SetIndexBuffer(1, fxh);
  SetIndexBuffer(2, sql);
  SetIndexBuffer(3, sqh);

  SetIndexStyle(0, DRAW_LINE);
  SetIndexStyle(1, DRAW_LINE);
  SetIndexStyle(2, DRAW_LINE);
  SetIndexStyle(3, DRAW_LINE);

  SetIndexEmptyValue(0, 0.0);
  SetIndexEmptyValue(1, 0.0);
  SetIndexEmptyValue(2, 0.0);
  SetIndexEmptyValue(3, 0.0);

  SetIndexShift(0, shift);
  SetIndexShift(1, shift);
  SetIndexShift(2, shift);
  SetIndexShift(3, shift);

  return(0);
}

//+------------------------------------------------------------------+
//| Custom indicator deinitialization function                       |
//+------------------------------------------------------------------+
int deinit()
{
  return(0);
}

//+------------------------------------------------------------------+
//| Custom indicator iteration function                              |
//+------------------------------------------------------------------+
int start()
{
  if (Bars < bars) return;
   if(prevtime1==iTime(NULL,0,0))
   {
      prevtime1=iTime(NULL,0,0);
      return(0);
   }
   else
   {
      prevtime1=iTime(NULL,0,0);
      if(data!="")
         bars=iBarShift(NULL,0,StrToTime(data));
   }
//----

  int mi; // ïåðåìåííàÿ èñïîëüçóþùàÿñÿ òîëüêî â start
  ip = bars;
  p=ip; // òèïà ïðèñâàèâàíèå
  sx[1]=p+1; // ïðèìå÷àíèå - [] - îçíà÷àåò ìàññèâ
  nn = degree+1;

  SetIndexDrawBegin(0, Bars-p-1);
  SetIndexDrawBegin(1, Bars-p-1);
  SetIndexDrawBegin(2, Bars-p-1);
  SetIndexDrawBegin(3, Bars-p-1);

//----------------------sx-------------------------------------------------------------------
  for(mi=1;mi<=nn*2-2;mi++) // ìàòåìàòè÷åñêîå âûðàæåíèå - äëÿ âñåõ mi îò 1 äî nn*2-2
  {
    sum=0;
    for(n=i0;n<=i0+p;n++)
    {
       sum+=MathPow(n,mi);
    }
    sx[mi+1]=sum;
  }
  //----------------------syx-----------
  for(mi=1;mi<=nn;mi++)
  {
    suml=0.00000;
    sumh=0.00000;
    for(n=i0;n<=i0+p;n++)
    {
       if(mi==1)
       {
         suml+=Low[n];
         sumh+=High[n];
       }
       else
       {
         suml+=Low[n]*MathPow(n,mi-1);
         sumh+=High[n]*MathPow(n,mi-1);
       }
    }
    b[mi]=suml;
    c[mi]=sumh;
  }
//===============Matrix=======================================================================================================
  for(jj=1;jj<=nn;jj++)
  {
    for(ii=1; ii<=nn; ii++)
    {
       kk=ii+jj-1;
       ai[ii,jj]=sx[kk];
    }
  }
//===============Gauss========================================================================================================
  for(kk=1; kk<=nn-1; kk++)
  {
    ll=0;
    mm=0;
    for(ii=kk; ii<=nn; ii++)
    {
       if(MathAbs(ai[ii,kk])>mm)
       {
          mm=MathAbs(ai[ii,kk]);
          ll=ii;
       }
    }
    if(ll==0) return(0);
    if (ll!=kk)
    {
       for(jj=1; jj<=nn; jj++)
       {
          tt=ai[kk,jj];
          ai[kk,jj]=ai[ll,jj];
          ai[ll,jj]=tt;
       }
       tt=b[kk];
       b[kk]=b[ll];
       b[ll]=tt;
       tt=c[kk];
       c[kk]=c[ll];
       c[ll]=tt;
    }
    for(ii=kk+1;ii<=nn;ii++)
    {
       qq=ai[ii,kk]/ai[kk,kk];
       for(jj=1;jj<=nn;jj++)
       {
          if(jj==kk) ai[ii,jj]=0;
          else ai[ii,jj]=ai[ii,jj]-qq*ai[kk,jj];
       }
       b[ii]=b[ii]-qq*b[kk];
       c[ii]=c[ii]-qq*c[kk];
    }
  }
  x[nn]=b[nn]/ai[nn,nn];
  y[nn]=c[nn]/ai[nn,nn];
  for(ii=nn-1;ii>=1;ii--)
  {
    mm=0;
    tt=0;
    for(jj=1;jj<=nn-ii;jj++)
    {
       mm=mm+ai[ii,ii+jj]*x[ii+jj];
       x[ii]=(1/ai[ii,ii])*(b[ii]-mm);
       tt=tt+ai[ii,ii+jj]*y[ii+jj];
       y[ii]=(1/ai[ii,ii])*(c[ii]-tt);
    }
  }
//===========================================================================================================================
  for(n=i0;n<=i0+p;n++)
  {
    suml=0;
    sumh=0;
    for(kk=1;kk<=degree;kk++)
    {
       suml+=x[kk+1]*MathPow(n,kk);
       sumh+=y[kk+1]*MathPow(n,kk);
    }
    fxl[n]=x[1]+suml;
    fxh[n]=y[1]+sumh;
  }
//-----------------------------------Std-----------------------------------------------------------------------------------
  suml=0;
  sumh=0;
  for(n=i0;n<=i0+p;n++)
  {
    suml+=MathPow(Low[n]-fxl[n],2);
    sumh+=MathPow(High[n]-fxh[n],2);
  }
  suml=MathSqrt(suml/(p+1))*kstd;
  sumh=MathSqrt(sumh/(p+1))*kstd;

  for(n=i0;n<=i0+p;n++)
  {
    sqh[n]=fxh[n]+sumh;
    sql[n]=fxl[n]-suml;
  }

  return(0);
}
//+------------------------------------------------------------------+
Comments