FX_FISH Mod2_v2.1
Download script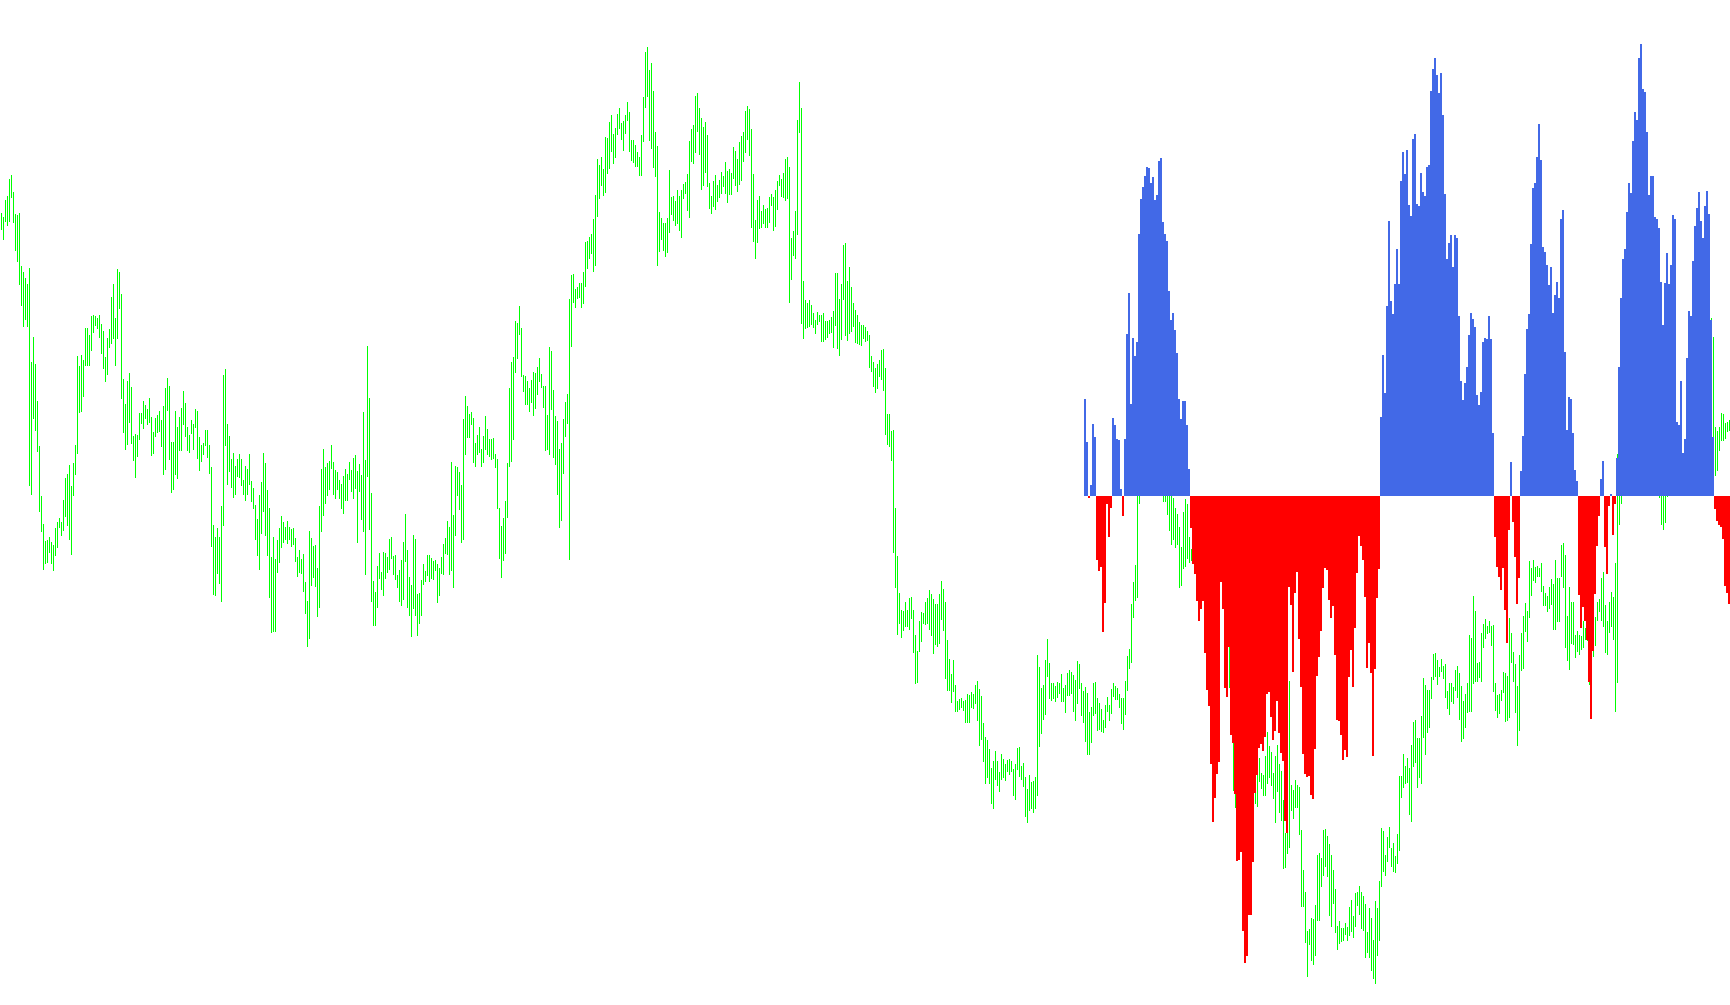
The FX_FISH script is a technical analysis tool designed to visualize market momentum and identify potential trend reversals or entries. Rather than looking at simple price movements, it processes historical data to calculate a weighted "momentum value" that helps traders distinguish between active trends and cooling periods.
How the Logic Works
1. Data Foundation The tool begins by analyzing a specific window of recent price history (the "period"). It identifies the highest highs and lowest lows within this timeframe to establish a boundary for the market's current range. It then selects a specific reference point—such as the average price, the closing price, or the midpoint of the candle—to determine where the current price sits relative to those boundaries.
2. Weighted Calculation The core logic uses a mathematical "smoothing" process. It calculates how far the current price has moved from its recent range and combines this with previous data points. This prevents the indicator from reacting too wildly to minor, insignificant price flickers, ensuring that the resulting movement is a reflection of sustained market behavior.
3. The "Fish" Movement The script transforms these weighted values into a specialized calculation (a logarithmic progression). This results in the "Fish" value, which is displayed as a histogram on a separate window below the main price chart:
- Positive Values: Generally indicate upward momentum or "bullish" pressure.
- Negative Values: Generally indicate downward momentum or "bearish" pressure.
4. Signal Generation The indicator looks for specific mathematical crossovers to alert the trader:
- Buy Signals: Triggered when the momentum exceeds a specific positive threshold and is actively moving upward faster than its previous positions.
- Sell Signals: Triggered when the momentum drops below a specific negative threshold and is moving downward more aggressively than its previous positions.
- Exit Alerts: The script also monitors for "momentum exhaustion," where the direction of the trend flips (e.g., moving from positive to negative), providing a notification that a trend may be ending.
Summary for the User
Essentially, this tool acts as a momentum thermometer. It filters out market "noise" by looking at price ranges over time, calculates the strength of the current movement, and provides visual cues (and optional audio/pop-up alerts) when the market shows strong, accelerating pressure in either direction.
// FX_FISH
#property copyright "Copyright © 2005, Kiko Segui"
#property link      "webtecnic@terra.es"

#property indicator_separate_window
#property indicator_buffers 2
#property indicator_color1 Lime
#property indicator_color2 Red
#property indicator_level1 0.2
#property indicator_level2 0.5
#property indicator_level3 1.0
#property indicator_level4 -0.2
#property indicator_level5 -0.5
#property indicator_level6 -1.0
// #property indicator_maximum 2
// #property indicator_minimum -2


double buffer1[];
double buffer2[];


extern int period=30;
extern int price=6; // 0 or other = (H+L)/2
                    // 1 = Open
                    // 2 = Close
                    // 3 = High
                    // 4 = Low
                    // 5 = (H+L+C)/3
                    // 6 = (O+C+H+L)/4
                    // 7 = (O+C)/2
extern bool Mode_Fast= True;
extern bool Signals= False;

int init()
  {
  SetIndexStyle(0,DRAW_HISTOGRAM,STYLE_SOLID,3,RoyalBlue);
  SetIndexBuffer(0,buffer1);
  SetIndexStyle(1,DRAW_HISTOGRAM,STYLE_SOLID,3,Red);
  SetIndexBuffer(1,buffer2);
  return(0);
  }


int deinit()
  {
  return(0);
  }


double Value=0,Value1=0,Value2=0,Fish=0,Fish1=0,Fish2=0;

int buy=0,sell=0;

int start()
  {
  int i;
  int barras;
  double _price;
  double tmp;

  double MinL=0;
  double MaxH=0;

  double Threshold=1.2;

  barras = Bars;
  if (Mode_Fast)
    barras = 1;
  i = 300;
  while(i>-1)
   {
   MaxH = High[Highest(NULL,0,MODE_HIGH,period,i)];
   MinL = Low[Lowest(NULL,0,MODE_LOW,period,i)];

   switch (price)
     {
     case 1: _price = Open[i]; break;
     case 2: _price = Close[i]; break;
     case 3: _price = High[i]; break;
     case 4: _price = Low[i]; break;
     case 5: _price = (High[i]+Low[i]+Close[i])/3; break;
     case 6: _price = (Open[i]+High[i]+Low[i]+Close[i])/4; break;
     case 7: _price = (Open[i]+Close[i])/2; break;
     default: _price = (High[i]+Low[i])/2; break;
     }


   Value = 0.33*2*((_price-MinL)/(MaxH-MinL)-0.5) + 0.67*Value1;
   Value=MathMin(MathMax(Value,-0.999),0.999);
   Fish = 0.5*MathLog((1+Value)/(1-Value)) -0.5*Fish1 -0.5*Fish2;

   buffer1[i]= 0;
   buffer2[i]= 0;

   if ( (Fish<0) && (Fish1>0))
     {
     if (Signals)
       {
       Alert("EXIT: "+DoubleToStr(i,0),"EXIT AT "+DoubleToStr(_price,4),7,"Arial",White);
       }
     buy = 0;
     }
   if ((Fish>0) && (Fish1<0))
     {
     if (Signals)
       {
       Alert("EXIT: "+DoubleToStr(i,0),"EXIT AT "+DoubleToStr(_price,4),7,"Arial",White);
       }
     sell = 0;
     }

   if (Fish>=0)
     {
     buffer1[i] = Fish;
     }
   else
     {
     buffer2[i] = Fish;
     }

   tmp = i;
   if ((Fish<-Threshold) &&
       (Fish>Fish1) &&
       (Fish1<=Fish2))
     {
     if (Signals)
       {
       Alert("SELL SIGNAL: "+DoubleToStr(i,0),"SELL AT "+DoubleToStr(_price,4),7,"Arial",Red);
       }
     sell = 1;
     }

  if ((Fish>Threshold) &&
       (Fish<Fish1) &&
       (Fish1>=Fish2))
    {
    if (Signals)
       {
       Alert("BUY SIGNAL: "+DoubleToStr(i,0),"BUY AT "+DoubleToStr(_price,4),7,"Arial",Lime);
       }
    buy=1;
    }

   Value1 = Value;
   Fish2 = Fish1;
   Fish1 = Fish;

   i--;
   }
  return(0);
  }
//+------------------------------------------------------------------+
Comments